- Features by Edition
- Latest Features
- Licensing/Activation
- Installation
- Getting Started
- Data Sources
- Deployment/Publishing
- Server Topics
- Integration Topics
- Scaling/Performance
- Reference
- Specifications
- Video Tutorials and Reference
- Featured Videos
- Demos and screenshots
- Online Error Report
- Support
- Legal-Small Print
- Why Omniscope?
|
|
|
|||||
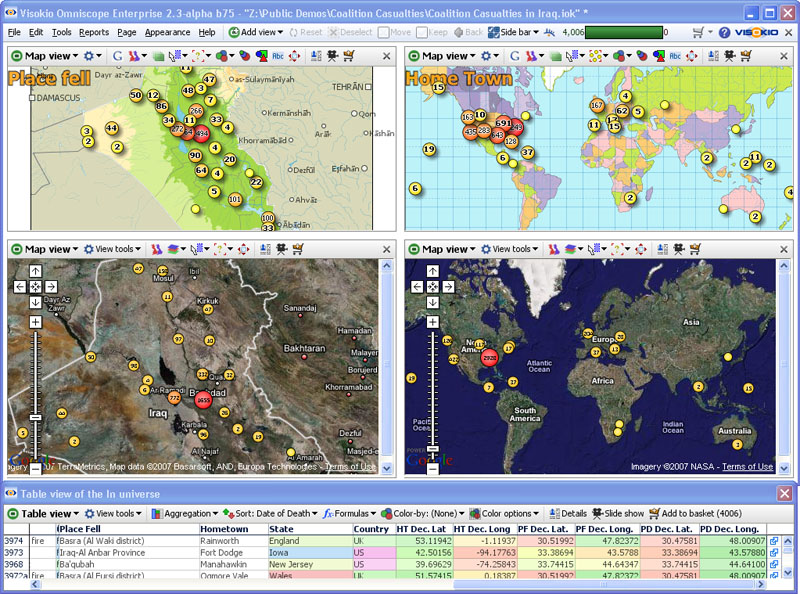
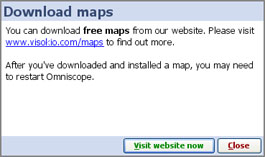
Using MapsUsing MapsLocation, location & location{update to 2.5 on progress} Omniscope allows you to use embedded vector maps that work offline, or online mapping services, such as Google Maps. Users can change from one zooming map background to the other within the Map View. Omniscope includes a wide selection of freely dowloadable vector maps (world, county or city level) which can be downloaded automatically and added into any file. Coordinate data in your data set is automatically plotted on maps or scanned images, such as floor plans. Markers can also be placed manually and Omniscope will automatically capture the coordinates to your data set. For more information on freely downloadable maps and how to use them, please visit our Maps Library. Map ViewsOmniscope permits you to have multiple map views, using either vector maps (work offline) or Google Maps backdrops (work online only). The example below shows both vector and Google Maps being used to display the same coordinate data, visible in the Table View at the bottom (click image to see larger version in a separate window).
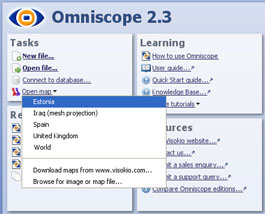
Map Views allow easy zooming, selection and filtering of records (rows) based on location. You can use mouse mode controls and zoom options to manage the display, and then select groups of records on which to perform Move or Keep power queries. To learn more about navigating, selecting and filtering, see the User Guide section Using the Map View, and the KnowledgeBase sections on Maps & Coordinates. Adding MapsYou can add embeddable vector maps to your local library and files from the File > Open map command, which is also accessible from the opening desktop Tasks menu. Downloading a map from our Maps Library adds it to your local collection. If you use the map in a file shared with others, and they do not have the map, it will be automatically downloaded for use in the file. It is also possible to embed maps in files if necessary.
You can use any type of scanned image as map- floor plans, sports fields, logistics and supply chain charts, etc. To learn how to calibrate coordinates for display on scanned images rather than map projections, see Changing Projections in the Knowledge Base. Adding geographic coordinates to your dataEvery map defined in Omniscope requires you to specify two columns to contain the Longitude (X) and Latitude (Y) coordinate values used to plot the records (rows) on the map. There are currently three ways to add geographic decimal coordinate (longitude and latitude) column values to your data for map displays; 1.) Locate your records in Omniscope using the free Visokio world, country and city vector maps- just select each record in the table view and place the markers manually to generate the coordinates in new fields (columns) automatically; 2.) Look up missing coordinates using online sources for finding coordinates such as Google Earth (and often Wikipedia). In Google Earth, look up the missing places, set a placemark, then read off the placemark coordinate values, then type or cut-and-paste the two Longitude and Latitude values into Omniscope columns; 3.) Merge the columns into your Omniscope data automatically using a merge file. To merge in coordinate columns for capital cities or geographic centres of countries, we supply free 'By Countries' merge file containing these columns. We also supply a free 'By Cities' merge file containing coordinates for about 60,000 of the world's largest cities. Free merge files 'By post code' are also available for the UK and the U.S., and a growing number of other countries as well. Other free and licensed reference merge files may be available from data vendors in future. |