- Features by Edition
- Latest Features
- Licensing/Activation
- Installation
- Getting Started
- Data Sources
- Deployment/Publishing
- Server Topics
- Integration Topics
- Scaling/Performance
- Reference
- Specifications
- Video Tutorials and Reference
- Featured Videos
- Demos and screenshots
- Online Error Report
- Support
- Legal-Small Print
- Why Omniscope?
|
|
|
|||||
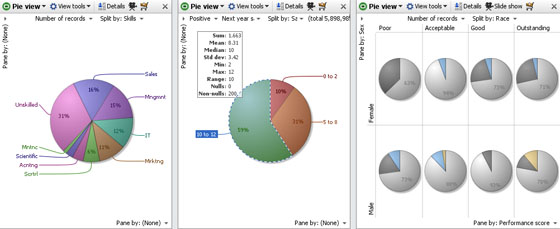
Pie ViewUsing the Pie ViewThe Pie View shows a proportional breakdown of your data, either categories, or numeric. The default on opening for the first time is to show the breakdown by number of records. You can select the field to display and the field to use to split the pie into segments by using the view controls. If your data set has both positive and negative values, you can specify which to plot. You cannot plot both positive and negative values on the same pie, but you can use two Pie Views side-by-side for this purpose. If you must show both positive and negative values in relation to each other, use the Bar View. You can select subsets of the data set on the pies, then execute
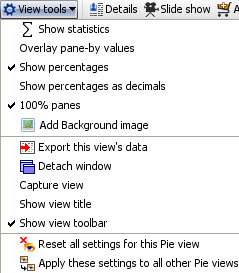
Pie View ControlsField selector- shows all the fields whose values can be divided into segments. The default is to display the number of records divided by the field chosen in the adjacent Split-by drop down. You can choose a text field (column) to display, but if you do, the breakdown will be by number of characters in the text string values. Split by- click on the ‘Split by’ drop down to choose a field to use to create segments within the pie(s). Pane by- paning means displaying more than one pie chart within the display, horizontally, vertically, or both as shown in the example above right. Pane by field (column) selectors in the upper left and lower right of the Pie View display enable you to select criteria for generating multiple pies within the same Pie View. This is not the same as using two different Pie View windows. When paning, you can use the 100% panes option in the View tools menu (see below) so that each of the multiple pies shows a breakdown totalling 100%. Use paning sparingly...if there is not enough space around each pie, Omniscope will not be able to display the labels, as shown in the example above. Pie View ToolsThe View tools drop-down menu offers a number of options
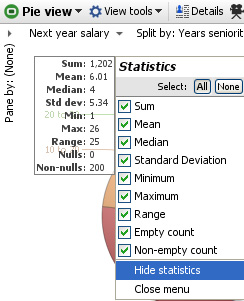
The rest of the commands on the View tools menu are common to all views and are documented in the section on View Tools Pie View statistics panelThe statistics panel display can be configured using the drop-down menu accessed from the upper right corner of the panel.
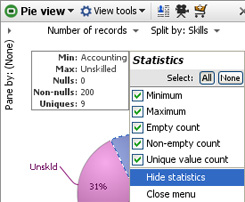
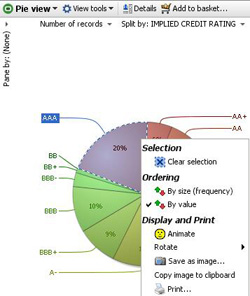
If the field (column) displayed is numeric, there will be more types of statistics available. If the field is a category field, summations, means, etc. will not be available. Pie View right-click menuRight-clicking anywhere on the Pie View window displays a menu of options to modify or export the display:
Copy and Print options: Save as image or Copy image to clipboard- saves or pastes an image of the Pie View display (.JPG, .GIF, .PNG or .BMP depending on Java version) into another document. Print- launches the Print wizard common to all views and documented in View Tools |