Using the Network View
Visualising connections and hierarchies
The Network View creates a virtual network of interconnecting nodes in your machines' memory to help visualise relationships in your dataset. Each node within a network represents a data subset and lines connecting the nodes indicate the relationships between these subsets. You can use one of many inbuilt layout algorithms to position the nodes within the view, or use your mouse to move the node arrangement around to create a custom layout best suited to your data.
Choosing the network type
When you first open a new Network View you will be asked to select a network type. The network type determines how the network will be built based on the relationships in your data set. There can be more than one network type used for a given data set using multiple Network Views.
For any given Network View, there are two broad options for specifying the type of network you wish to visualise, Grouped Hierarchies and Relational Networks:
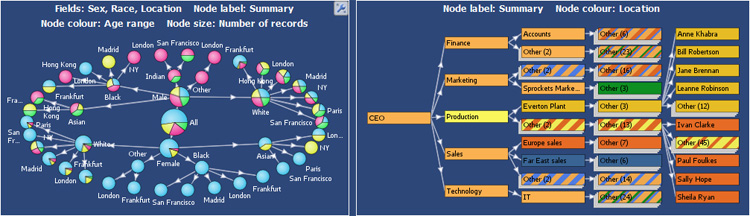
Grouped HierarchiesA grouped hierarchy can be used tovisualise almost any type of data. In a grouped network each node represents a group of records. Once you have selected a grouped hierarchy use the field selector on the Network View toolbar to definethe columns in your data set to be included within the network. Each field (column) chosen will define another 'level' within the hierarchy. At eachlevel, the records will be split by the associated field values. Relational NetworkArelational network can be used to represent any dataset where a commonrelationship exists between the rows. Each row should define a 'key' field and one or more 'linked fields'. The 'key' field should provide a unique identifier for the row entity. For example, for a data set comprised of people, the 'key' field might be the person's name, insurance number or other identifier unique to thatparticular person. The 'linked' fields create the linkage(s) to another entity, defining the key value for the linked entity, thereby allowing the network to determine which entities are connected. | | 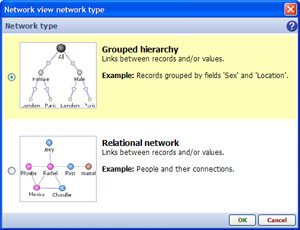 |
Network View Toolbar
Like the View Toolbar displayed in other views, the Network View Toolbar contains a View Selector, Data Subset Selector and the Aggregate options drop-down menu that function in the same way as they do in other views. The View Tools drop-down contains first the commands specific to the Network View, and then the commands common to all views.

To the right of View Tools drop-down are the options menus specific to the Network View; Appearance options, Node options, Selection Mode options, Zoom options, Fields selector, Layout options, Navigator pop-up and Node Labelling, Colouring, Outlining and Sizing options. These menus are discussed in the sections below.
Appearance Options Dialog
The Appearance options dialog is immediately to the right of the View Tools drop-down. This is a large, multi-tabbed dialog that allows you to configure the colour, size and shape of the nodes, lines and labels within the network. There are three tabs; Nodes, Lines and Labels, with many options on each tab.
Nodes - options relating to the shape, size, colour and images used to represent the Nodes in your data
Lines - options relating to the display, thickness, colour, arrows and arrow positioning of the Lines between the Nodes
Labels - options relating to the display of labels, field (column) names, empty values, and the spacing, alignment, fonts and background used
All of the Appearance dialog options on all three tabs are documented
hereNetwork View Toolbar - Node type options
The Node Type options allows you to choose how nodes in the network will be portrayed. The Network View currently provides two node shape options: markers for which a range of shapes can be selected, and square/rectangular boxes.
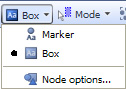
| | Marker - a marker consists of an arbitrary shape and a label shown adjacent to the marker. The marker option is particularly useful when visualising networks with a large number of nodes.
Box - a box is a rectangular shape for each node. The box label is shown inside the box and is always visible. Box nodes usually require more space than marker nodes and, as such, are more useful when visualising networks with a small number of nodes.
Node Options - use the Appearance options > Node options tab to select the shape to be used for markers and to set the size and shape of boxes. |
Network View Toolbar - mouse Mode options
This menu provides users the option to control the behavior of the mouse when navigating and filtering the network. The mouse mode options in the Network View are the same as those used in other views, such as the Graph and Map Views.
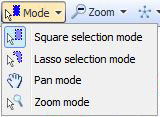 | | Square selection - allows you to select and move node. To select one or more nodes hold down the left mouse button and drag the mouse across the view panel. A rectangular shape is created as a result of dragging the mouse. All of the nodes that are enclosed within the rectangular shape are included in the selection. To move a node simply move the mouse over the top of the node, hold down the left mouse button and drag the node to the desired location. You can move several nodes at once by selecting the nodes then moving any node from the selection.
Lasso selection - lasso selection is used in the same way as the square selection; the difference is that a flexible lasso shape is used to manage the selection instead of a rectangle. With a lasso you can move the mouse to create a free-form shape, thereby allowing for more complex selections of one or more free-form areas.
Pan - The pan mode allows you to navigate the network by moving the screen to frame the desired area. Once you select the pan mode a 'hand' icon will appear. Hold down the left mouse button and drag the mouse to move the window in the corresponding direction. Whilst using the pan mode you can use the mouse wheel to zoom in and out of the network.
Zoom - The zoom mode allows you to zoom in or zoom out of the current network. To zoom to a specific area hold down the left mouse button and drag the mouse to create a rectangle highlighting the area to zoom to. To zoom in or out of the map hold down the right mouse button and drag the mouse up (to zoom in) or down (to zoom out).
|
Network View Toolbar - Zoom options
Zoom options in the Network View are very similar to those provided in the Graph and Map Views. The slider and the zoom buttons allow you to increase or decrease the magnification level. The following additional controls are provided:
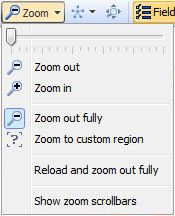 | | Zoom out fully - Zooms the graph out to the full extent. This menu item is highlighted whenever the network is zoomed out fully.
Zoom to custom region - Changes the interaction mode to the 'Zoom' mode. This menu item is highlighted whenever the network is zoomed to a custom magnification.
Reload and zoom out fully - Reloads the entire graph, applies the current layout algorithm and zooms out to the full extent.
Show zoom scrollbars - Indicates whether the zoom scrollbars are displayed. The zoom scrollbars are shown to the right and at the bottom of the view. They allow you to both zoom and pan the view window. |
Network View Toolbar Fields Picker
The Fields chooser allows you to define which fileds (columns) are displayed or hidden, and functions just as it does in most other Omniscope Views
Network View Toolbar - Layout selection
Specifying Layout Options allows you to apply a pre-defined layout algorithm to the current network. The position of the Nodes within the network is determined according to the parameters of the chosen layout algorithm. The Network View currently provides seven layout algorithms:
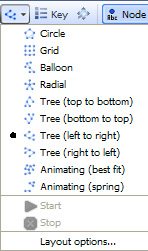 | | For examples of each, see Layout Examples
Circle - In the circle layout all of the nodes are evenly spaced across the edge of a circle.
Grid - In the grid layout the nodes are placed across the view with an even horizontal and vertical spacing. This gives the impression that the nodes are the corners of a grid.
Balloon - In the balloon layout the child nodes are placed around the outside of the parent. This pattern is repeated for the entire graph.
Radial - The radial layout consists of several 'layers' of nodes. Each layer is represented as a circle; the innermost circle contains the root nodes, and each subsequent circle contains nodes from the next level of the hierarchy.
Tree - The tree layout determines the positions of the nodes based on a classic network tree; nodes at the root of the hierarchy appear at the top of the tree and their descendents are placed further down. There are four orientation options.
Best fit - (animated) The best fit layout uses a similar algorithm to the spring layout; however it is designed to run for an arbitrary period of time and then stop. The Best fit layout algorithm is generally better suited to larger volumes of data than the Spring layout.
Spring - (animated) The spring layout attempts to find theoptimal position of the nodes based on their connection to other nodes.It may be best to describe the spring layout by asking you to imaginethat all of the links between nodes are actually springs. If nodes areconnected they will be pulled together, with the 'pull' between thenodes being greater the further apart they are. The spring algorithm isbetter suited to smaller volumes of data.
Layout options - accesses the Layout options dialog (see below) |
Network View Toolbar - Layout options dialog
Under the Layout selection drop-down is a link to the Layout options dialog, which allows you to modify the behaviour of the various layout algorithms.
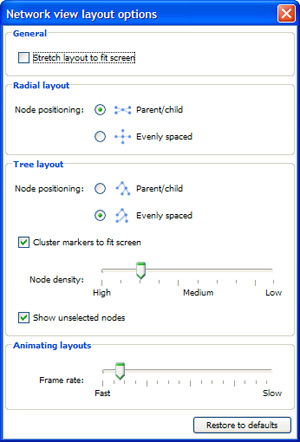 | | General: Stretch layout to fit screen - If this optionis checked all of the nodes in the layout will be stretched out so thatthe maximum amount of screen space is used. Stretching is done bydefault in some layouts (Tree, Grid), and this preference will have noeffect if one of these layouts is in use. A good example of the effectchanging this preference can have is to create a network and select the'Circle' layout. Now select 'Stretch layout to fit screen'. You shouldsee the circle of nodes stretch out to form an ellipse.
Radial layout: Node positioning - defines how the node position is determined when the radial layout is in use: - Parent/Child - children are grouped together underneath the parent node. Thismakes the network hierarchy much clearer, but may mean a large number ofnodes are overlapping.
- Evenly spaced - nodes in each level of the hierarchy are evenly spaced out.
Tree layout: Node positioning. Same as above.
Cluster markers to fit screen - when checked, nodes too close together are 'clustered' tocreate a single node. Clustering can only be applied if the network ishierarchical, i.e. it has a root node, and the root has zero or more childnodes that in turn have zero or more child nodes...with each node having asingle parent node.
Node density - determines how close nodes have to be to each other before they areclustered. If the density is set to 'High' then the space between eachnode is reduced, therefore allowing for a high number of nodes. If thedensity is set to 'Low' then the space between each node is increased,equating to a small number of nodes.
Show unselected nodes - determines whether nodes which have not been selected are shown.
Animating layouts: Frame rate -The Network View currently provides two animated layouts:Spring and Best fit. Use this slider to determine how fast thelayouts run. If your network is large and complex, setting a fast speedcould have a detrimental effect on performance. |
Network View Toolbar - Navigator
Click on the 'Navigator' button to open a small network navigation window. The navigator window will be docked on the right hand side of the view however it can be dragged and placed anywhere on screen.
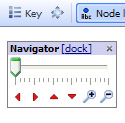
| | Zoom slider - Moving the zoom slider or clicking on the Zoom In or Zoom out buttons allows you to increase or decrease the magnification. Navigation arrows - Clicking on the red navigation buttons allow you to shift the view in the corresponding direction Zoom magnifiers - |
Network View Toolbar - Node label
The Node Label drop-down allows you to determine how the label attached to each node is constructed.
| | The dropdown provides three types of measure: - Number of records - displays the number of records associated with the node.
- Summary - displays summary details associated with the node.
- Field name - constructs the label based on the value of all the records for the selected field. If the field is numeric and there is more than one value the label value will be determined by applying the function specified in the 'Number field function' sub-menu. If the field is textual and there is more than one value the field value will not be shown.
You can select as many of these measures as you want. So you could choose to show 'Number of records' and 3 fields. The order these are shown is determind by the order they are shown in the drop-down. You can change the order by clicking and dragging the measure to the preferred position in the list. |
Network View Toolbar - Node colour
The Node Colour drop-down menu allows you to specify the measure used to determine how Node colouring is calculated.
| | There are currently three types of measure: - None - the default option, no measure is used, instead node colour is the base colour setting as specified in the Appearance Options dialog.
- Number of records - the node colour is determined by the number of records represented by the node. If a node represents a large number of records then the colour of the node will be close to the colour specified at the higher end of the graded colour scheme.
- Field name - you can choose to colour nodes by a particular field inside the dataset. If the field is numeric and there is more than one value the colour of the node is determined by applying a function to all of the values. You can choose which function to use by using the 'Function' sub-menu in the drop-down. The 'Function' sub-menu is only visible when a numeric field is selected. If the field is textual and there is more than one value either multi-colour lines or a pie-chart are used to show the values for the selected field. You can choose the fill type by using the 'Fill type' sub-menu in the drop-down. The 'Fill type' sub-menu is only visible when a numeric field is selected.
|
Network View Toolbar - Node outline
The node outline drop-down menu allows you to specify the measure used to determine how the node outline is calculated. The Node outline option can be used in exactly the same way as the Node colour menu. You might find it easier to identify the node colour outline by increasing the outline thickness. You can modify the outline thickness using the Node options dialog.
Network View Toolbar - Node size
The node size drop-down menu allows you to specify the measure used to determine the size of a node in relation to the other nodes on screen.
| | There are currently three types of measure: - Node - the default option. No measure is used, instead the node size is the base size setting as specified in the Appearance options dialog.
- Number of records - the node size is determined by the number of records represented by the node. If a node representsa large number of records then the node will appear larger.
- Field name - you can choose to size nodes based on a particular numeric field in the dataset. The larger the value for the selected field, the larger the node. If the node represents more than one value then the value used to determine the size is calculated by applying the function selected in the 'Function' sub-menu.
|