- Features by Edition
- Latest Features
- Licensing/Activation
- Installation
- Getting Started
- Data Sources
- Deployment/Publishing
- Server Topics
- Integration Topics
- Scaling/Performance
- Reference
- Specifications
- Video Tutorials and Reference
- Featured Videos
- Demos and screenshots
- Online Error Report
- Support
- Legal-Small Print
- Why Omniscope?

|
|
|||||
Venn ViewVenn ViewVisualise intersections & overlaps among defined data queries/subsetsThe Venn View is based on the familiar Venn diagram. This view enables visualisation and filtering on overlaps between up to 5 different named query data sets or subsets, which must first be pre-defined as Named Queries. Notice that the number of records (or other measure specified in Value/Function) not included in any selected set/subset is displayed upper left after the heading 'Outside'. In the HR example below right, the median age of all the staff not included in one of the selected subsets is 42.
Venn View Toolbar
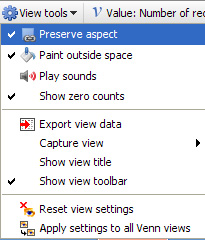
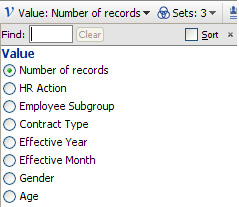
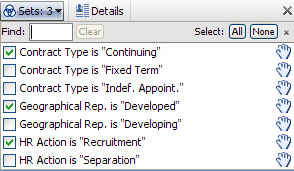
Venn View Toolbar View picker, Data Subset selector, Aggregate options drop-down and the show Details all function the same as they do in all the views. View Toolbar options unique to the Venn View include the upper-pane View tools options, the Value: menu to specify the values to be used, and the Sets: menu to specify the existing Named Query data subsets (maximum 5) for which Venn shapes will be displayed. Venn View Tools
Venn View Value/Function:
Venn View Sets:
|


