- Features by Edition
- Latest Features
- Licensing/Activation
- Installation
- Getting Started
- Data Sources
- Deployment/Publishing
- Server Topics
- Integration Topics
- Scaling/Performance
- Reference
- Specifications
- Video Tutorials and Reference
- Featured Videos
- Demos and screenshots
- Online Error Report
- Support
- Legal-Small Print
- Why Omniscope?
|
|
|
|||||
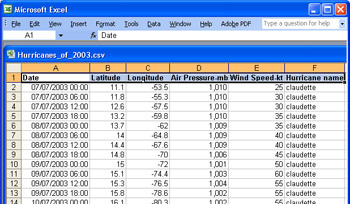
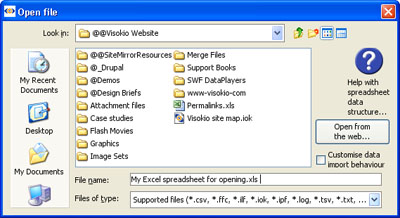
OverviewGetting started with OmniscopeA one-page overview of using OmniscopeOmniscope free Viewer will open any Omniscope .IOK file of any size, up to the limits of your PC. Each new Viewer installation also includes a free 30-day trial of Omniscope Professional. During the 30-day trial period, you can import your own data from spreadsheets and databases, and you can export data from any of the embedded or online demos as spreadsheet files to see how these files were configured from tabular data. You can also use the DataPlayer View to create exportable, interactive Flash DataPlayers for embedding in web-based 'dashboards' and common documents like PowerPoint, Excel and Adobe Acrobat .PDF. After the 30 day free trial expires, the installatation reverts to being a free Viewer, so there is never a need to un-install. Install OmniscopeIf you don't yet have Omniscope installed, install the free Viewer. The installation sequence (for Windows) is shown here. Select a data file to importYou can open tabular data sets such as spreadsheet files directly in Omniscope. A sample 6-column .CSV file for use with this Quick Start page is attached here. Download the sample data file, or choose a different file containing your own data. Try to avoid any blank rows, formatting and merged cells in your source spreadsheet file. Check that your spreadsheet looks like this.
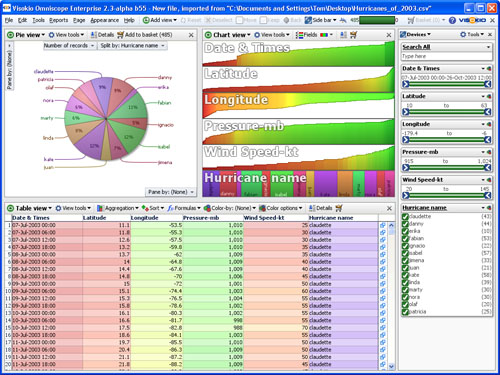
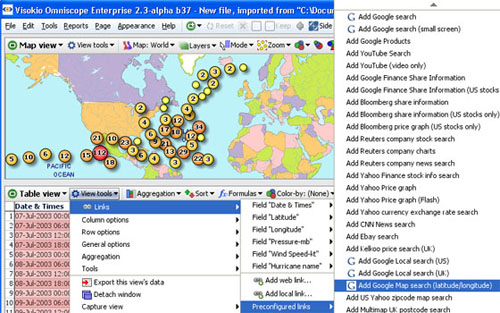
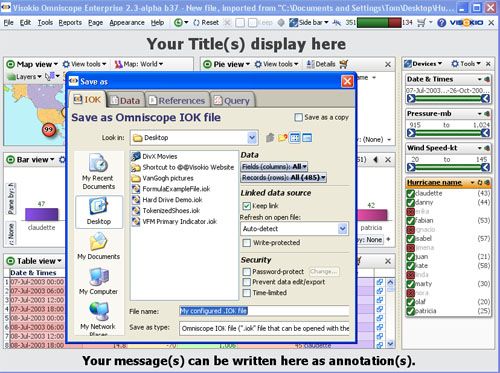
During your 30-day trial period, or if you are already running an activated Edition, you can open any of the demo files and use File > Export > Export files and select the Data tab to save the data as a CSV or other supported file type. You can then re-import the data using File > Open file, and compare with the embedded demo to see how the demo file looked before it was configured. For more detail, see the section on Importing Data. Opening ViewOmniscope will open the file displaying three default views; a Table View, a Chart View and a Pie View, as well as the right Sidebar, with various filter devices created by default.
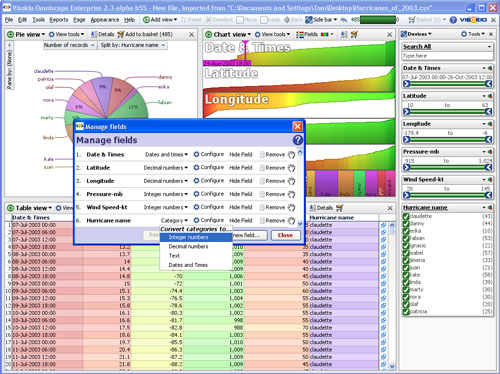
The Table View is most familiar, but the Chart View is very useful for gaining insight into the structure of the data set at a glance. Confirm Data TypesOmniscope examines the data in each column and makes some assumptions about the column's data type, which are not always optimal. When importing data for the first time, always check and (if required) modify the data typing (i.e. whether a column's data is typed Numbers, Dates and Times or Text). If there are only a limited number of different Text values, Omniscope will usually type the data as Category. To review and edit data typing, click on Data > Manage Fields.
Frequently, Omniscope assumes that identifying numbers should be treated as integer numbers. You should change the data type of all-numeric reference identifiers to 'Text'. Remove the separators in the number before converting to text using Options > Formatting options: {untick} Show thousands separator. Also, for some date and time fields you may be asked to clarify the date/time format used in your data before Omniscope can recognise it accurately as dates and times. For more detail on data typing options see Data > Manage Fields. Explore & Check Data:Each view has a View Toolbar that enables you to perform many operations on the display in that view. For example, in the Table View you can click on the column headers to sort each column in different directions. You can also check your data by using the Aggregation selector to aggregate the records by main categories, then right-clicking on each column header and selecting various aggregation functions, allowing you to see averages, minima, maxima, empty cells etc. for various categories, often detecting incorrect values. 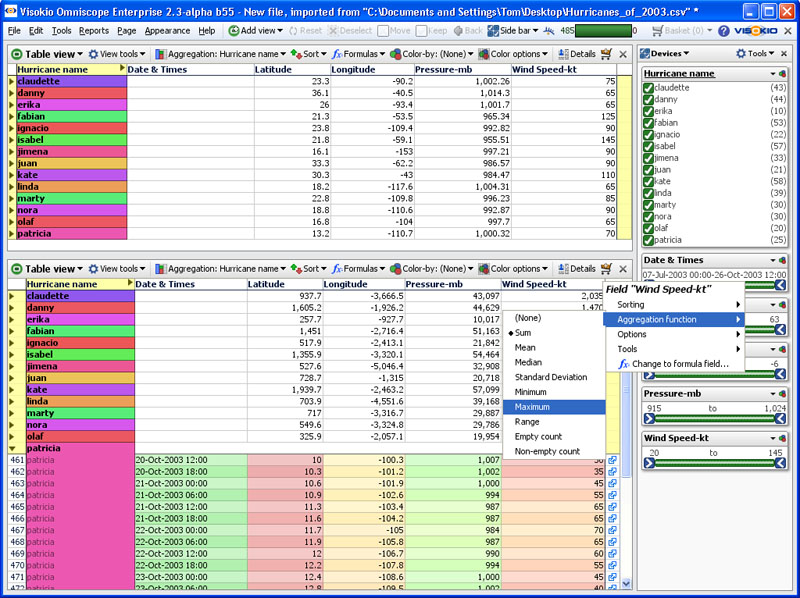
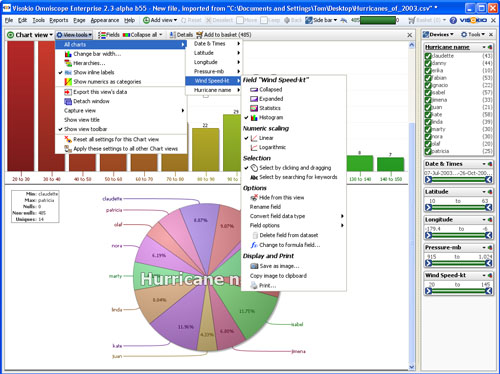
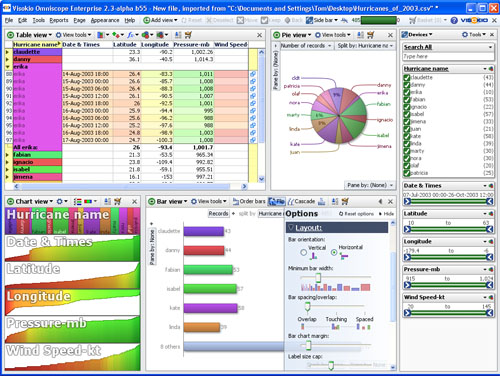
Using the hurricane example file, close the Pie and Chart Views, and open a Table View. Click on the Aggregation command to aggregate all the observations over time by Hurricane Name. By default, all of the columns will show the sum of the observations, nonsensical in this case. Right-click on each column header, choose Aggregation function and display the median for the Longitude and Latitude columns, the mean (average) Pressure and the maximum Wind Speed. The example above shows two Table Views, the lower with the aggregation functions defaulting to Sum, and the upper showing the same data with the view configured to show meaningful results that can be used to spot errors in the data. From version 2.4, the Aggregation drop down menu on the View Tolbar can be used to set both the fields to aggregate on and the aggregation functions to apply to visible columns in the aggregated view. For more detail, see Using the Table View Visual scrubbing with Chart ViewNext open only the Chart View, which provides a horiziontal overview of all the columns in the data set. In the Chart View, under View Tools > All charts, for each field (column) name you can decide how to graph the values in each column, e.g. histogram bars, pie charts, statistical summaries, etc. Use this analytical view to further scrub your data.
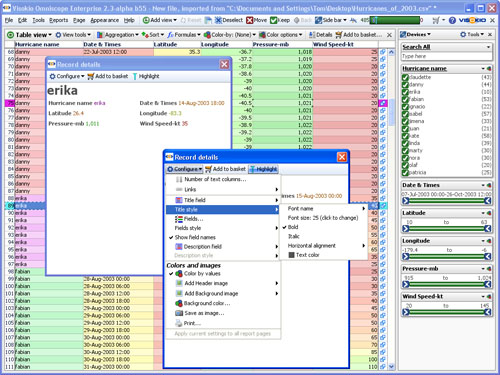
The right-click menu provides links to many other settings related to the selected field (column). You can re-order or hide fields that are not required by dragging or unticking them in the Fields drop-down pick list. For more detail see Using the Chart View Display DetailsTo see the values of all the fields for a given record (row), in the Table View, double-click on the record (row) header (farthest left). A configurable Details pop-up window appears, showing the values for the selected record. You can configure the Details pop-up window extensively using the Configure menu.
|