- Features by Edition
- Latest Features
- Licensing/Activation
- Installation
- Getting Started
- Data Sources
- Deployment/Publishing
- Server Topics
- Integration Topics
- Scaling/Performance
- Reference
- Guide to Views
- Keyboard Shortcuts
- Dates & Times
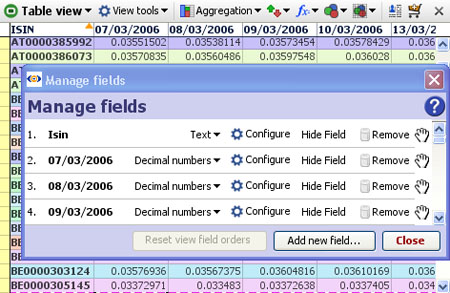
- Manage Fields
- Tokenised Data
- Using Formulae
- Scripting
- Mapping & GIS
- Advertising Options
- Legacy User Guide
- Translation Guide
- Specifications
- Video Tutorials and Reference
- Featured Videos
- Demos and screenshots
- Online Error Report
- Support
- Legal-Small Print
- Why Omniscope?
|
|
|
|||||
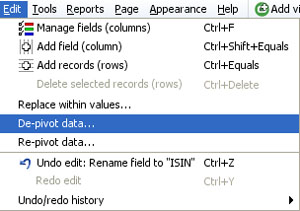
De/Re-Pivot (2.5)Data > Operations > Pivot & De-PivotChanging the orientation/layout of some or all of your data setSometimes source data is laid out 'horizontally' in rows when Omniscope would manage it better 'vertically' in columns. Sometimes data needs to be exported from Omniscope in a layout/orientation different from that used in the Omniscope file. To avoid the time-consuming process of changing the orientation of data from horizontal to vertical (row becomes column) or vertical to horizontal (column becomes row), the Omniscope Edit menu has both a De-pivot data and Re-pivot data function.
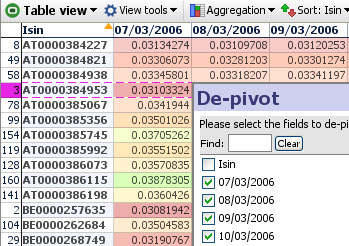
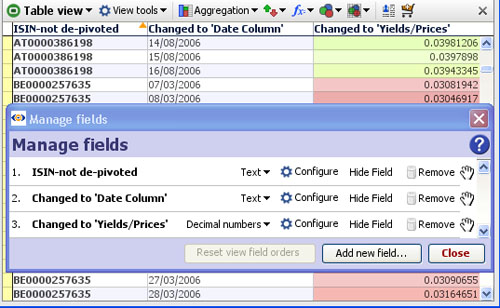
Data > De-Pivot data...Data tables containing repeated observations of values sometimes place each set of observations in a column, such as the example of daily bond yields by ISIN identifier below. This 'horizontal' layout with the dates of each observation in a separate column is not useful for time series analysis in Omniscope, so we use the Edit > De-pivot data wizard to change the layout/orientation of the data set:
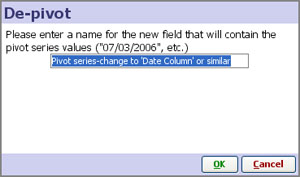
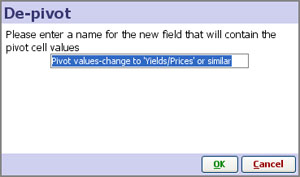
In this case, the ISIN identifier is already in a single column, so we do not need to create another column. We therefore untick this column from the list of columns to be De-pivoted as shown above. In the new data layout, we want all the dates of reported yields/prices to be in one column, which we can re-name 'Date' or similar. Next to the new 'Date' column (the pivot series values), for each ISIN we want the observed Yield/Price for that day (the pivot cell values), which we can rename accordingly:
Given the information above, Omniscope will automatically change the data layout/orientation accordingly, with the ISIN reference duplicated for each date, and the column names changed to those you specified. Note: do not worry about the 'vertical' duplication of the ISIN values. This duplication is only visible in the Table View and does not appear in the reports and charts
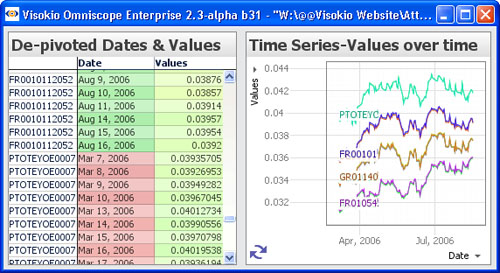
With the data now in 'vertical' Omniscope layout, we can use the Graph and other views to display the time series:
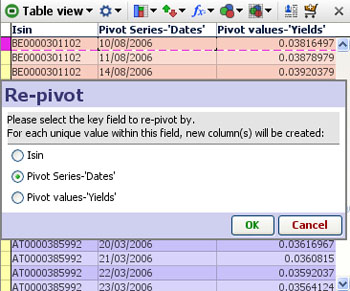
Edit > Re-Pivot data...Sometimes you may need to do the reverse of De-pivoting, i.e. converting a single column into many different columns by unique values. For example, you may need to export a data set in spreadsheet format with a layout/ data orientation different from that used in your Omniscope reporting file. The Edit menu also contains a Re-pivot data function which performs these changes in data layout or orientation automatically. In the example below, we are going to convert this data set from the 'vertical' layout with the dates all in one column, to a 'horizontal' layout with a column for each date and the observations under each date.
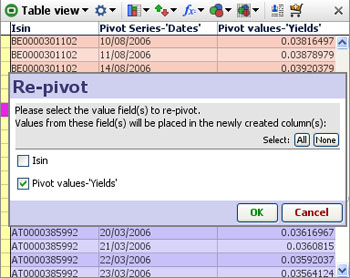
We want to keep the ISIN column as a column, so we select Dates as the pivot series as shown above, then we select Yields as the value fields to be arranged under the new date columns as shown below:
The result of the Re-pivot is a typical 'horizontal' data layout/orientation:
|