- Features by Edition
- Latest Features
- Licensing/Activation
- Installation
- Getting Started
- Data Sources
- Deployment/Publishing
- Server Topics
- Integration Topics
- Scaling/Performance
- Reference
- Specifications
- Video Tutorials and Reference
- Featured Videos
- Demos and screenshots
- Online Error Report
- Support
- Legal-Small Print
- Why Omniscope?
|
|
|
|||||
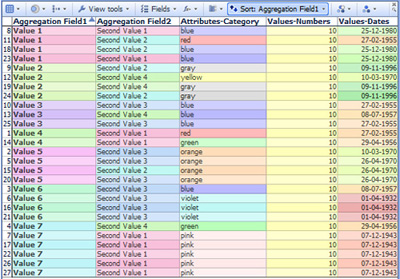
Aggregating DataAggregating DataDisplay different data aggregations within viewsFrom version 2.5, most Omniscope View Toolbars include an Aggregation drop-down dialog which enables you to define an aggregated transformation of the underlying granular data set, and also define the aggregation functions to be applied across the aggregated values in each field (column). Each view on any given tab can use a different aggregated view as defined by the settings on the View Toolbar Aggregation drop-down. Note: Formula columns can be set to apply the defined logic to the aggregated, rather than individual, row values by choosing 'Apply formula' as the aggregation function for the formula field. Defining Aggregated ViewsConsider the unaggregated data set illustrated below and downloadable here. Potential 'Aggregation Field 1' has 7 unique values, and potential 'Aggregation Field 2' has an additional 4 values uncorrelated with the 7 values in 'Aggregation Field 1'. In addition, there are Category, Numeric and Time & Date fields in the data set:
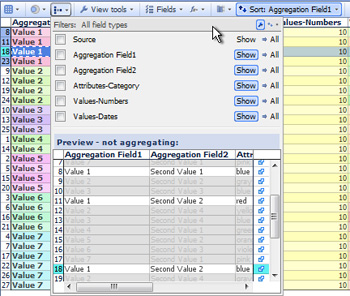
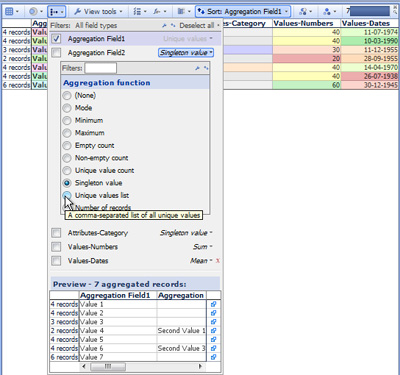
Use the Aggregation drop down menu found on most View Toolbars to define view-specific aggregated transformations of the underlying data set. The example above shows how to customise the drop-down fields and use the Preview window. In this case, the uniform value field 'Source' is being hidden, since aggregating by a single value will collapse the entire data set into one row. Notice that selections in the view are shown with brushing (fading) in the Preview window, enabling us to confirm that Value 1 is associated with both Second Value 1 and 2.
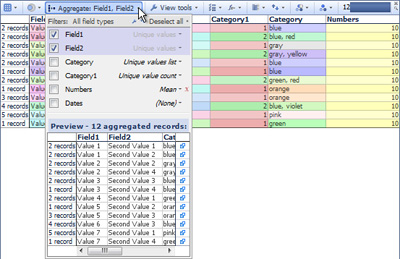
Aggregating by multiple fields will usually increase the resulting row count, since all unique combinations of field values from all fields will become aggregate rows. IN the example below, the data set is being aggregated by both Field 1 and Field 2, resulting in 12 rows as shown in the mini-barometer:
Aggregation vs Table View: Grouping optionMany Views include an Aggregation drop-down menu, used to define aggregated views of the data, together with the function to be applied when aggregating each field (column). Aggregation differs from the presentational Grouping options available only in the Table View. Unlike Grouping, the end user is not meant to 'unroll' or 'drill down' defined aggregations to lower levels of granularity. User-interactive Grouping can be used in the Table View in addition to Aggregation. For example, a file with each row defined as an observation for a given day can be aggregated by week, then grouped by month and year. In the resulting presentational Table View, an end user would be able to unroll the groupings down to weeks, but to see the maximum granularity daily data, they would either have to remove the Aggregation settings (which they cannot do in a free Viewer) or just click to the 'Data Set tab (which they can do in a free Viewer).
|