
GIS: Map View - Overlays (e.g. boundaries)
-
Omniscope's Map View supports adding multiple data layers, known as overlays.
In this example we are going to analyse data relating to cities in the USA and add an overlay of USA state areas to improve the visualisation.
ATTACHMENTS- USA cities.zip - Contains an Esri Shapefile of USA city data, including latitude/longitude locations.
- USA states.zip - Contains an Esri Shapefile of USA state areas.
INSTRUCTIONS- Download and unzip "USA cities.zip" and "USA states.zip".
- Create a new file in Omniscope and go to DataManager.
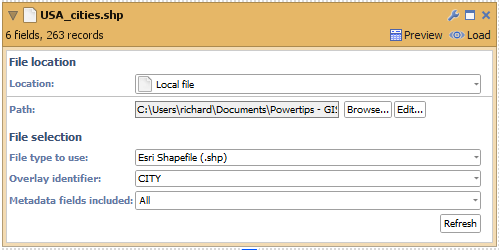
- First we need to load the USA cities data into Omniscope. Drag "USA_cities.shp" on to the DataManager workspace.
- Expand the block and next to "Overlay identifier", select "CITY". This means that Omniscope will use the city name to uniquely identify every record.
- Next to "Metadata fields included", select all fields. This will load all meta-data from the Esri Shapefile.
- Execute the block and load it into Omniscope.
- Now that the city data is loaded we can begin exploring it. Go to the 'DataExplorer' tab.
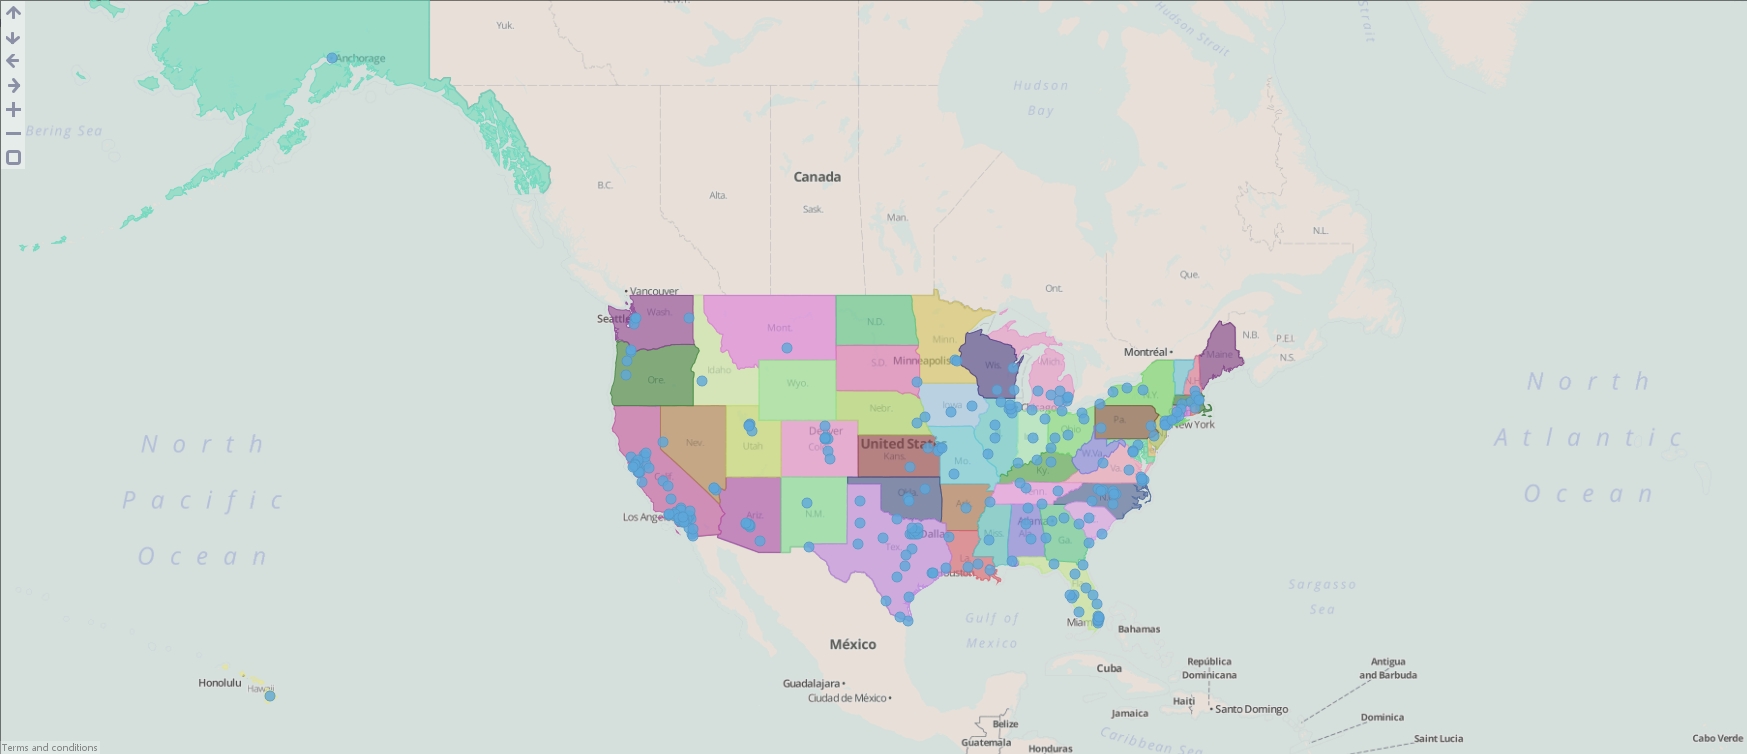
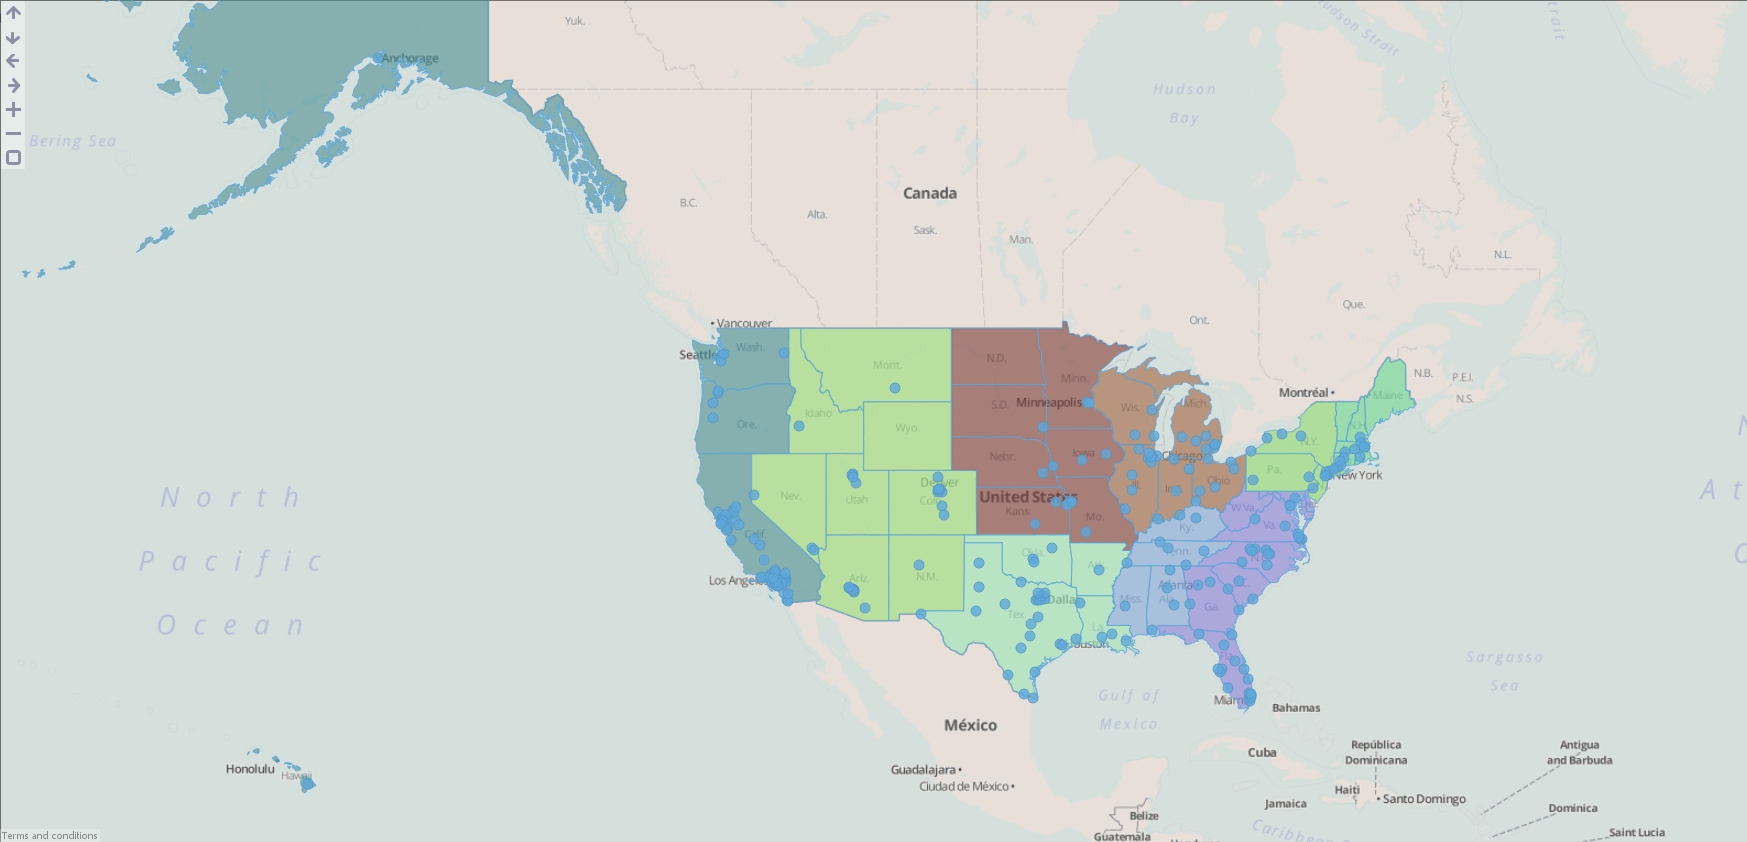
- Change the Bar/line View to a Map View, which will display the location of each city.
- The cities are now visible on the map but we can add an overlay of the USA state areas to summarise the data. Drag the "USA_states.shp" onto the Map View and select 'Open as a map overlay'.
- The next dialog allows you to customise how the data will be imported. This contains the same options you saw in the DataManager block earlier. Next to "Overlay identifier", select "STATENAME" to use USA state names as unique identifiers for each area in the file. Next to "Metadata fields included", select all fields. This will load all meta-data from the Esri Shapefile. Click "OK".

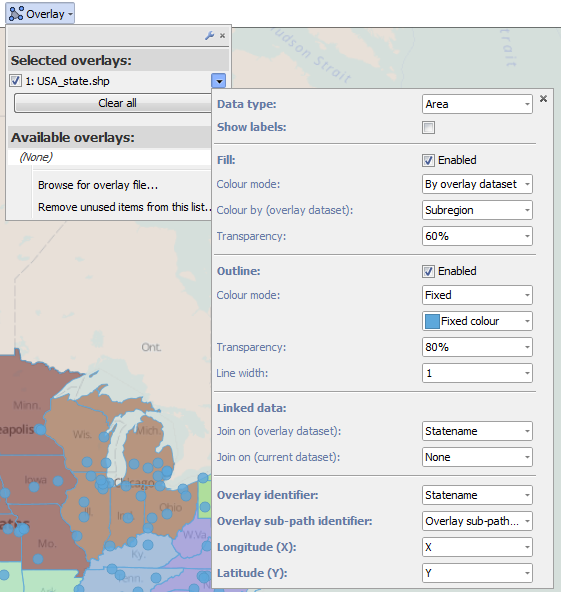
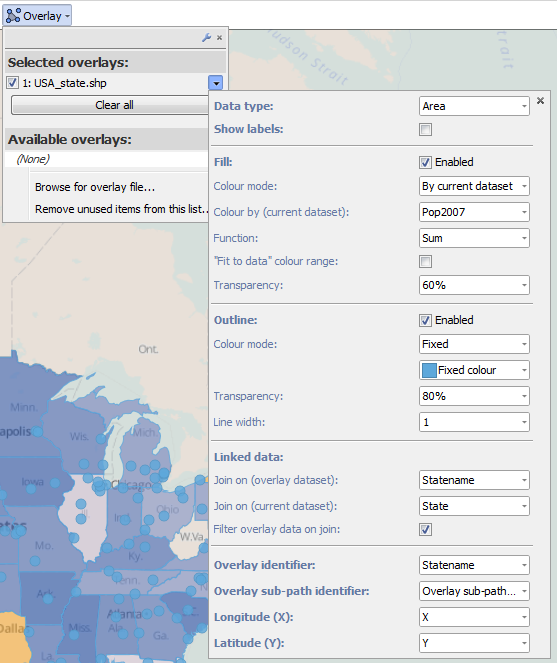
- Now we need to change the colour of the states. In the Map View toolbar, go to the "Overlay" menu and select the downward pointing arrow next to "USA_state.shp". This will display a panel containing advanced options for your overlay layer.
- Under "Outline", change "Colour mode" to "Fixed" and then choose a new colour from the new drop-down. This will update the outline colours of all USA state areas. More information on colour modes is available at the end of these instructions.
- Under "Fill", change "Colour by (overlay dataset)" to "Subregion". This uses the "Subregion" field in your overlay dataset (USA_state.shp) to generate category colours for each area.

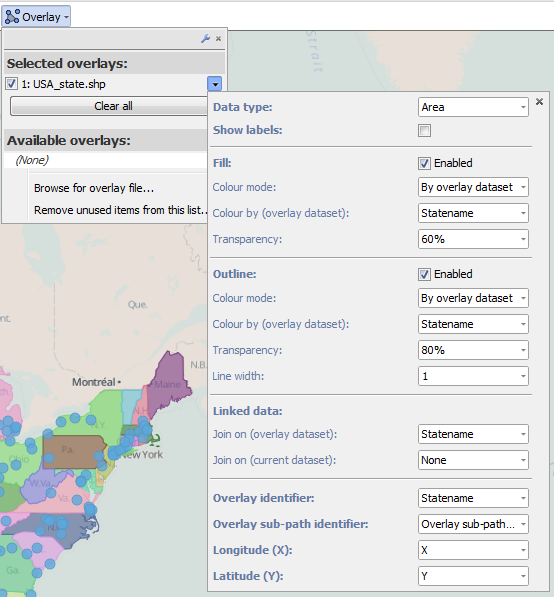
- You can also use data from your currently loaded dataset (USA_cities.shp) to colour the USA state areas. To do this use the same overlay configuration menu and under "Fill", change "Colour mode" to "By current dataset".
- You'll notice there is a message 'No "Linked data" field selected for the current dataset.'. For Omniscope to link these two datasets together we need a common field with values found in both datasets. Our sample SHP files both contain state names with common values so select "State" next to the "Join on (current dataset)" control to configure the link. We now have a basic relationship configured between the USA_cities dataset and the USA_state dataset.
- You might have noticed that some states, e.g. Wyoming, have disappeared from the map. By default after you have created this link between 2 datasets, Omniscope will not display any overlay areas which do not have related data in your currently loaded dataset. To disable this behaviour uncheck "Filter overlay data on join".
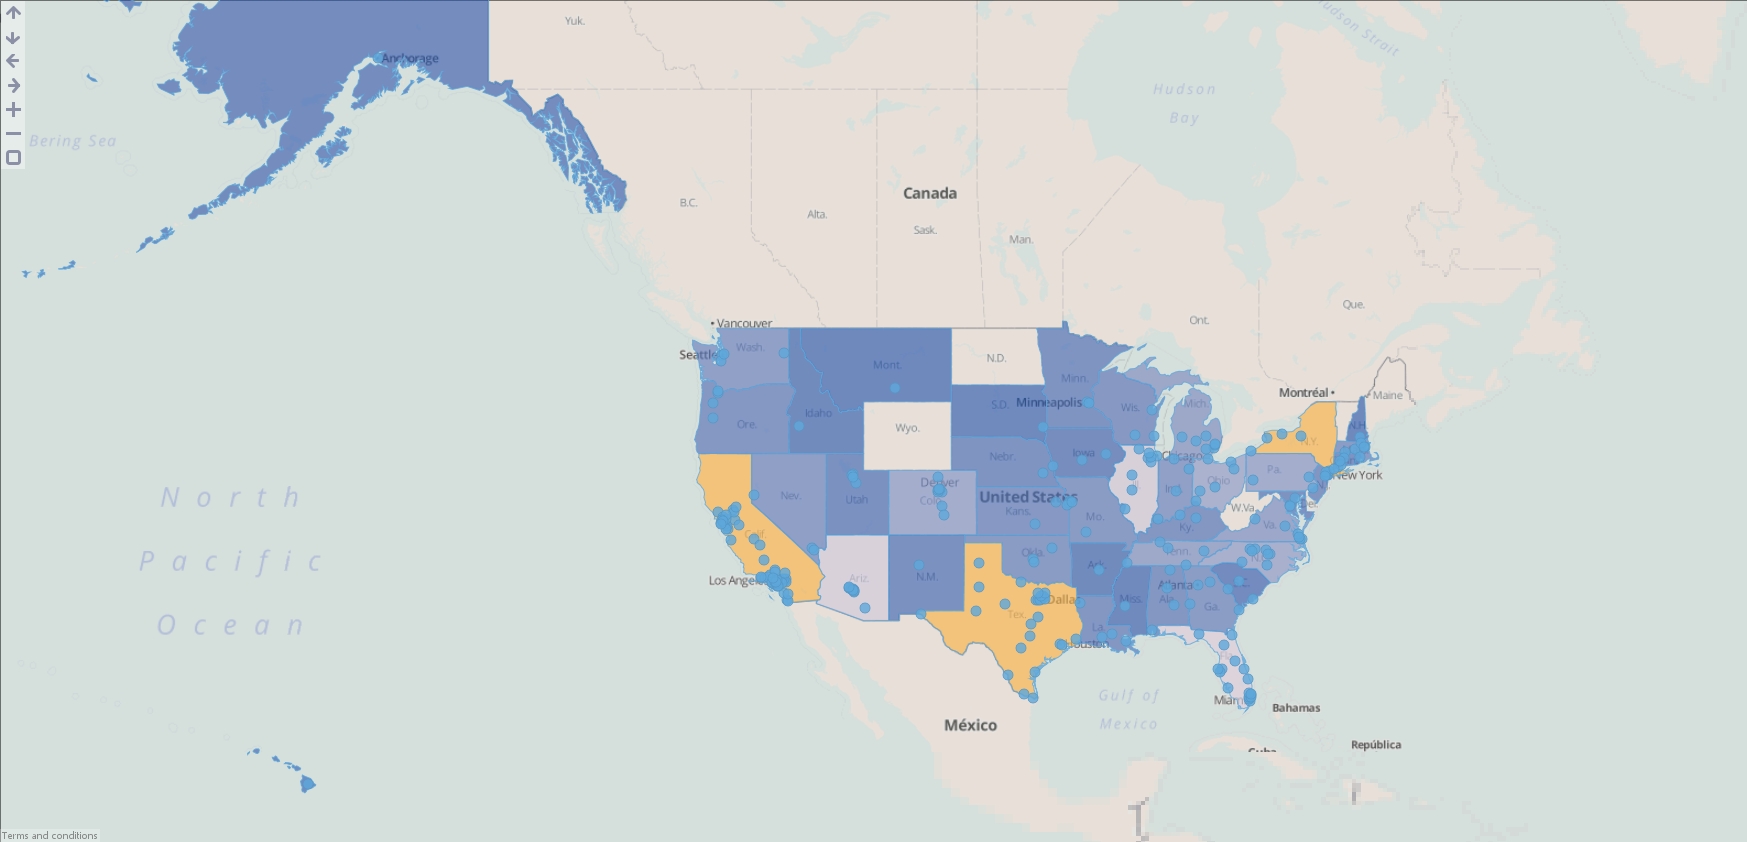
- The overlay is now configured to display state areas coloured by the number of linked records in the cities dataset. You can colour by a field in the current dataset by selecting from the drop-down next to "Colour by (current dataset)". Select "Pop2007" to use the population statistics for 2007. You can choose a function to summarise all the population statistics by selecting from the "Function" drop-down but we will leave this as "Sum".
- Your map is now displaying each USA state coloured by the total population across all cities within its area. Notice how California, Texas and New York all have same colour yet they have total populations of ~17.2m, ~10.5m and ~9.1m respectively. This is because we are using the original colour range from the "Pop2007" field which ranged from ~100k to ~8.3m. Any values above or below these limits will generate the same colour, which is misleading for our example. We can dynamically generate new colour limits by going back to the overlay "Fill" options and enabling '"Fit to data" colour range'.


ADVANCED
In the Map View overlay functionality you will come across terms like "Overlay ID", "Overlay identifier", "Data type". Below are explanations for each of these terms and how they are used by Omnsicope. If you are using KML or Shapefile sources then most of these fields will be configured automatically.
Data types- Point - A dataset containing pairs of latitude/longitude coordinates, e.g. a shop location.
- Line - A dataset containing connected, and unfilled/unclosed, chains of points, e.g. a hurricane path or road.
- Area - A dataset containing connected, and filled/closed, chains of points, e.g. a post code area or country border.
Colour modes- Fixed - Choose a single colour which will be applied to all data.
- By current dataset - Generate colours using a field from the currently loaded Omniscope dataset.
- By overlay dataset - Generate colours using a field from the embedded overlay dataset.
Fields- Overlay identifier - Field containing unique identifiers for each point, line or area in the input dataset, e.g. a field containing country names or postal area codes.
- Overlay sub-path identifier - This is used internally within Omniscope to identify nested geometries within each shape. For example a shape for the United Kingdom could not be drawn with one continuous line. We use this field to breakdown the records into numerous islands which make up the country.
- Longitude - Field containing WGS84 longitude values.
- Latitude - Field containing WGS84 latitude values.
-
6 Comments
-
Hi Richard,
I'm currently trying to place an overlay of a London borough .shp file that I've downloaded from http://data.london.gov.uk/taxonomy/keywords/boundaries over an Map: Online world (I've unzipped and placed all files into the same folder.)
I've tried to use the processed mentioned above, and also the Map View overlay button and it is not populating any boundaries onto the map.
Are there any parameters where an overlay will not just populate?
I thought it would be a case of selecting and shp overlay file and then it just populating on any map option in Omni?
thanks,
matt -
The shape file for London you are using contains OSGB coordinates not the lat/long WGS for it to work. You'll need to convert the values or find a compliant set of shapefiles.
-
Thanks Daniel :)
matt -
If you have an ArcGIS account or just sign up for a free one, you can go and get the public feature layers to find compliant shapefiles through there. It has a number of London Shapefiles so it's just about finding the one you want.
Most likely any publicly available GB shapefiles should already be there, just a case of looking around.
http://forums.visokio.com/discussion/2637/gis-importing-from-esri-arcgis-online
-
I also managed to find another work around regarding shp files with OSGB instead of WGS.
By using FWtools (which is free to download) I used the following linecode.
ogr2ogr -f "ESRI Shapefile" new.shp LSOA_2011_BFC_Barnet.shp -s_srs EPSG:27700 -t_srs EPSG:4326
this will generate a new shp file with WGs84 co-ords. the LSOA_2011_BFC_Barnet.shp file was my original file.
also, you have to point it in the right direction, where your original shp file is held, with a change directory commands i.e. "cd C:\mapping"
Quick question, does Omniscope offer brushing when it comes to overlays? I have got one shape file with multiple borough LSOAs, it does offer colouring options depending on linkage, but no brushing options from what I can tell?


Welcome!
It looks like you're new here. If you want to get involved, click one of these buttons!
Categories
- All Discussions2,595
- General680
- Blog126
- Support1,177
- Ideas527
- Demos11
- Power tips72
- 3.0 preview2
Tagged
To send files privately to Visokio email support@visokio.com the files together with a brief description of the problem.