
Data Visualisation: Stacking Bar Chart?
-
Hi Paola,
I'm trying to get a stacked chart to measure 3 stages of timeliness but I can't get it to work. I've attached an excel with a demo of the data and also a chart that to give you an idea, do you have advise? i would upload the iok but it's got too much sensitive data in it!Attachments
omniscope day tracker.xlsx 19K -
2 Comments
-
Perhaps I got carried away, but here are multiple options :-)
Data should be de-pivoted before visualisation, so you end up with all the phases under the single field.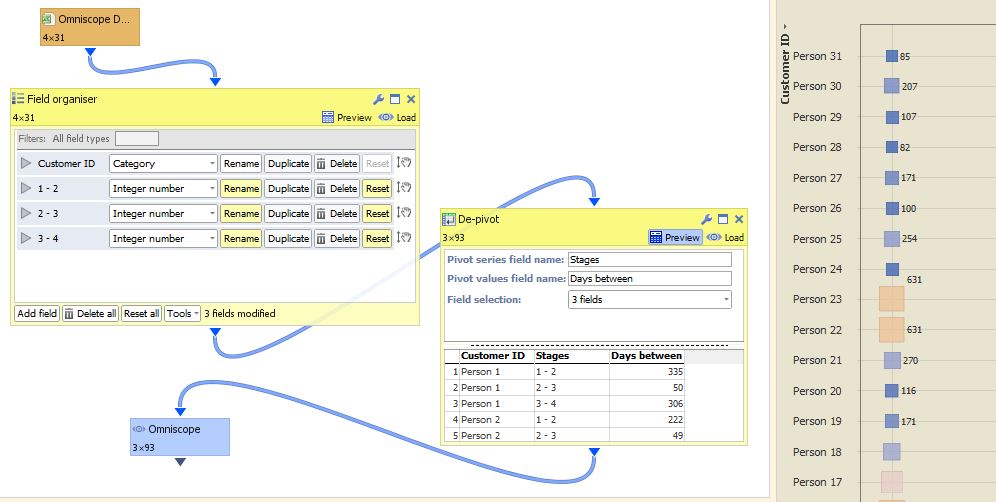

AttachmentsWaitingTime.iok 23K WaitingPreparation.JPG 75K 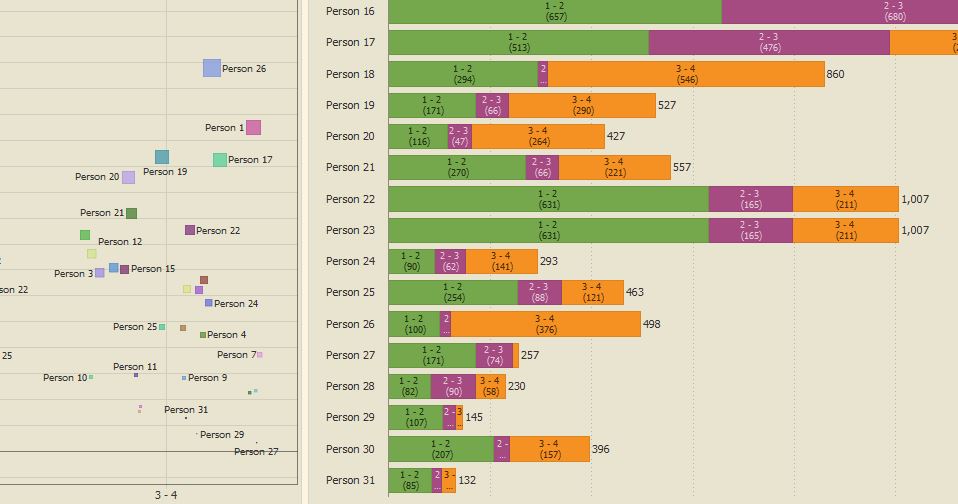
WaitingTime.JPG 69K -
that's great! I see what I was doing wrong now with the de-pivot.
thanks!

Welcome!
It looks like you're new here. If you want to get involved, click one of these buttons!
Categories
- All Discussions2,595
- General680
- Blog126
- Support1,177
- Ideas527
- Demos11
- Power tips72
- 3.0 preview2
Tagged
To send files privately to Visokio email support@visokio.com the files together with a brief description of the problem.