Bar/Line View: Cumulative Labels?
-
Hi, I have a set of data, that I have cascaded to show a cumulative representation on a line chart (i.e. the values building up over time). However, when you add on the data labels, it shows the non-cumulative values on the chart - is there a way of changing this around?
Also, I don't really want to show all the data labels, just the last value. I have seen some charts where this has been done and wondered if we can do this?
Cheers
Danny -
5 Comments
-
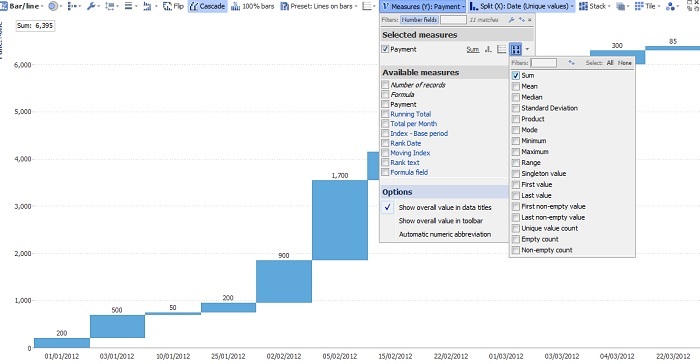
The idea is that you will see the individual values on top of the bars, and read the cumulative value on the axis. If you wish to display just the last cumulative value you can tick the Stats option under the Measures, then tick Sum, as per screenshot below.
 Attachments
cumulative.jpg 53K -
Sure, you have that option too, under the
Split menu>Options (little triangle menu)>Include total summary value "all". Attachments
cumulativePlusAll.JPG 46K
Welcome!
It looks like you're new here. If you want to get involved, click one of these buttons!
Categories
- All Discussions2,595
- General680
- Blog126
- Support1,177
- Ideas527
- Demos11
- Power tips72
- 3.0 preview2
Tagged
- Bar/Line_View102
- labelling40
To send files privately to Visokio email support@visokio.com the files together with a brief description of the problem.


