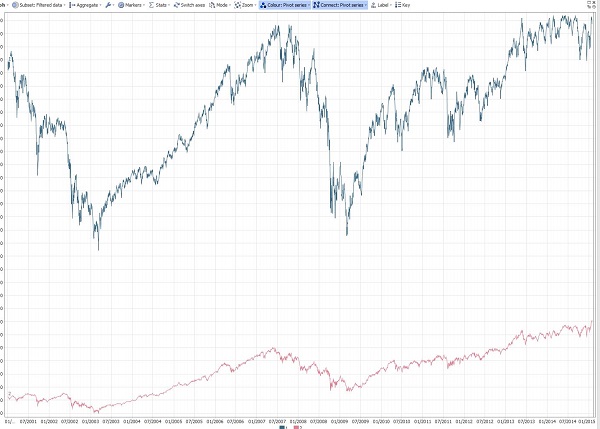
Graph view: Compressing date axis to print on one page?
-
Hi,
I have some line charts with measures in the Y axis and dates running along the X axis. Unfortunately, there are a lot of dates, so even with minimum splits width within layout at its lowest setting, the Bar/Line charts don't fit on one screen (only just fits on three by scrolling).
I'd like to be able to demo these charts, and to be able to print them so that they display all on one page (currently if I print I get about 1/3 of it).
Graph views seem more suited to this, but I can't find a way to have two measures overlaid like I do in my attached file (let me know if there's a way).
See the simple attached file to see what I mean.
Thanks
AlexAttachments
Wide Line Chart Demo.iok 49K -
4 Comments
-
You may wish to try the Graph View, but this will require slight change in your data structure.
In the DataManager use De-Pivot block for the fields [1] and [2]. Make sure the new field is classified as category data.
Now use the Graph view and connect the markers by series. File attached. Attachments
LongTimeSeries.jpg 77K 
Wide Line Chart Demo.iok 45K
Welcome!
It looks like you're new here. If you want to get involved, click one of these buttons!
Categories
- All Discussions2,595
- General680
- Blog126
- Support1,177
- Ideas527
- Demos11
- Power tips72
- 3.0 preview2
Tagged
- Bar/Line_View102
- Graph_view25
- printing15
- scrolling7
- x-axis6
To send files privately to Visokio email support@visokio.com the files together with a brief description of the problem.


