
Bar/Line View: Missing X axis values?
-
Created a Line Chart based on many series, filtered out by device. Had noticed when a series starts on a later time line, the x axis does not show values until the second series timeline starts.
See attached file. Is there a setting causing this?
Have selected Chart, changed the measure to be median and type line, split by date and layered and coloured by series. Tiled by another attribute in the series.
This affect appears when the graph is tiled, even if the data is of the same tile attribute. If the tile option is removed, the axis return to normal and show as expected.Attachments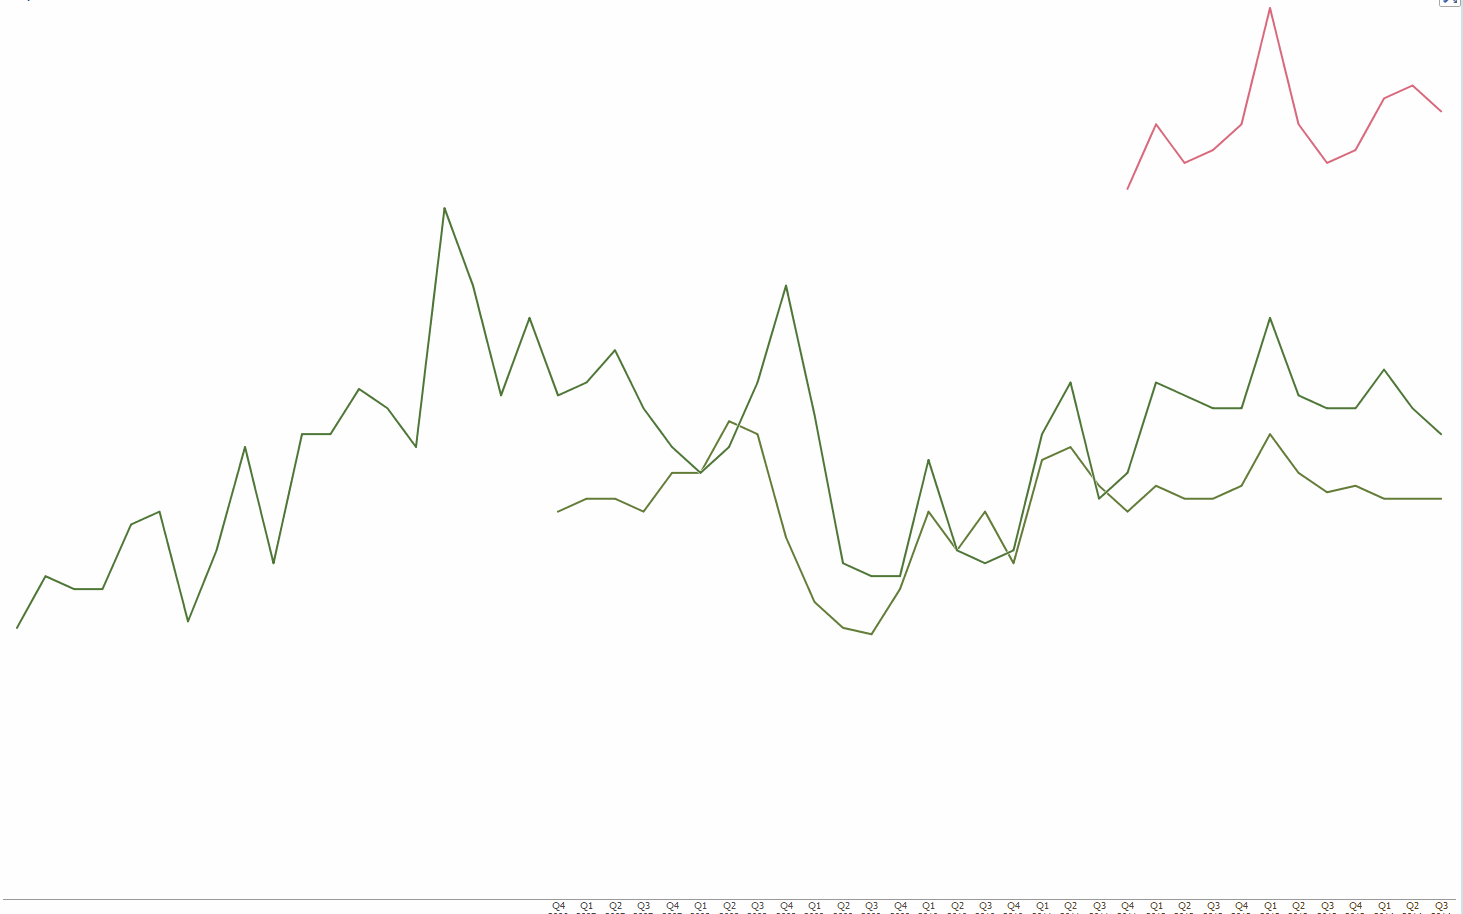
Missing X axis values.PNG 55K -
3 Comments
-
Cheers, that sorts it for now.

This discussion has been closed.
← All Discussions Welcome!
It looks like you're new here. If you want to get involved, click one of these buttons!
Categories
- All Discussions2,595
- General680
- Blog126
- Support1,177
- Ideas527
- Demos11
- Power tips72
- 3.0 preview2
Tagged
- Bar/Line_View102
- paning3
- tiling1
To send files privately to Visokio email support@visokio.com the files together with a brief description of the problem.