
Bar/Line View: Displaying null or zero value bars on X-axis
-
Hi - Is there a possibility, how to set a fixed values on the x-axis? My situation is as follows. I have a values of investment into different mediatypes per month and i want to create a bar view showing overall investment in each month (i.e. 12 bars). The problem is, that not all media types has values for each month (there was no investment in specific media type in given month). When I set a filter showing only mediatype with missing value in one month, this month is missing also on x-axis (in bar plot is then only 11 bars). Is there a way how to avoid this and have on the x-axis still numbers from 1 to 12 (as a months). The one with missing value will be empty or with null value respectively.
Thanks a lot, MichalMichal Charvat | Mindshare | Business Planning | www.mindshare.cz | www.mindshareworld.com -
17 Comments
-
Thanks for your reactions and valuable advices. Unfortunately my problem still remains. The problem is, that the choice of number of intervals only allows to limit the maximum number to 12, not to set the fixed number of intervals. Thus, if the value of investment for (for example) January and February is missing because in these months were no investment, my bar plot starts in March with first non-null value instead of in January (with value 0) and February (with value 0).
In graph view is a possibility to simple set the "Extend axis to custom range (x axis)" from 1 to 12 and problem is solved. But I didn't found analogous option in bar view.
Thanks again for your answers.Michal Charvat | Mindshare | Business Planning | www.mindshare.cz | www.mindshareworld.com -
Hi Michael,
We tried to recreate your problem by creating a sample file with zero value for Jan and Feb 2012, and a null/missing value for Dec 2011. The Bar/Line View can recognise/display both. Please have a look at the sample file below and compare the settings, field formats etc. If the problem persists, please send me your file (or simplified version), so we can have a look. ThanksAttachments
TimeSeriesStartZero.iok 6K -
Hi Paola,
Thanks for attached file and sorry for the delay of my response. In your particular case everything works fine but only because of the null value in Jan and Feb. My problem is, that for certain filtering options i do not have any value for these months. As you suggested, one example is worth thousand words. Everything is described in footer of appropriate views. Dont bother to contact me anytime, I really appreciate your help.
Thanks,
MichalAttachmentsTimeSeries.iok 13K Michal Charvat | Mindshare | Business Planning | www.mindshare.cz | www.mindshareworld.com -
Another answer related to the attached file - useful way to show several years with months 1 to 12 on x axis is to choose option Layer by [Year]. You can then choose from Preset menu to either have layered lines or bars, interleaved mesures, for different years for easier comparison.
-
I see the logic behing proposed solution of problem with displaying months with missing values. Nevertheless, practically is not possible because I would have to add months for every possible combination of filters. Real data set contains not only information about mediatype but also about category, advertiser, brand etc. Therefore I would have to add missing months for each mediatype by category, advertiser, brand and every other combination respectively. I do not want to waste your time with meaningless questions, so my last one is brief. Is there any way how to arrange fixed values on x axis in bar/line view as in graph view ("Extend axis to custom range")?
Thanks again for your time,
MichalMichal Charvat | Mindshare | Business Planning | www.mindshare.cz | www.mindshareworld.com -
Ok, thanks.Michal Charvat | Mindshare | Business Planning | www.mindshare.cz | www.mindshareworld.com
-
Here is a screenshot of the issue.
The difference between my lines is really small (few basis points), therefore I need to change the scale (range) of my Y axis from 0-100 to something like 100-102.Attachments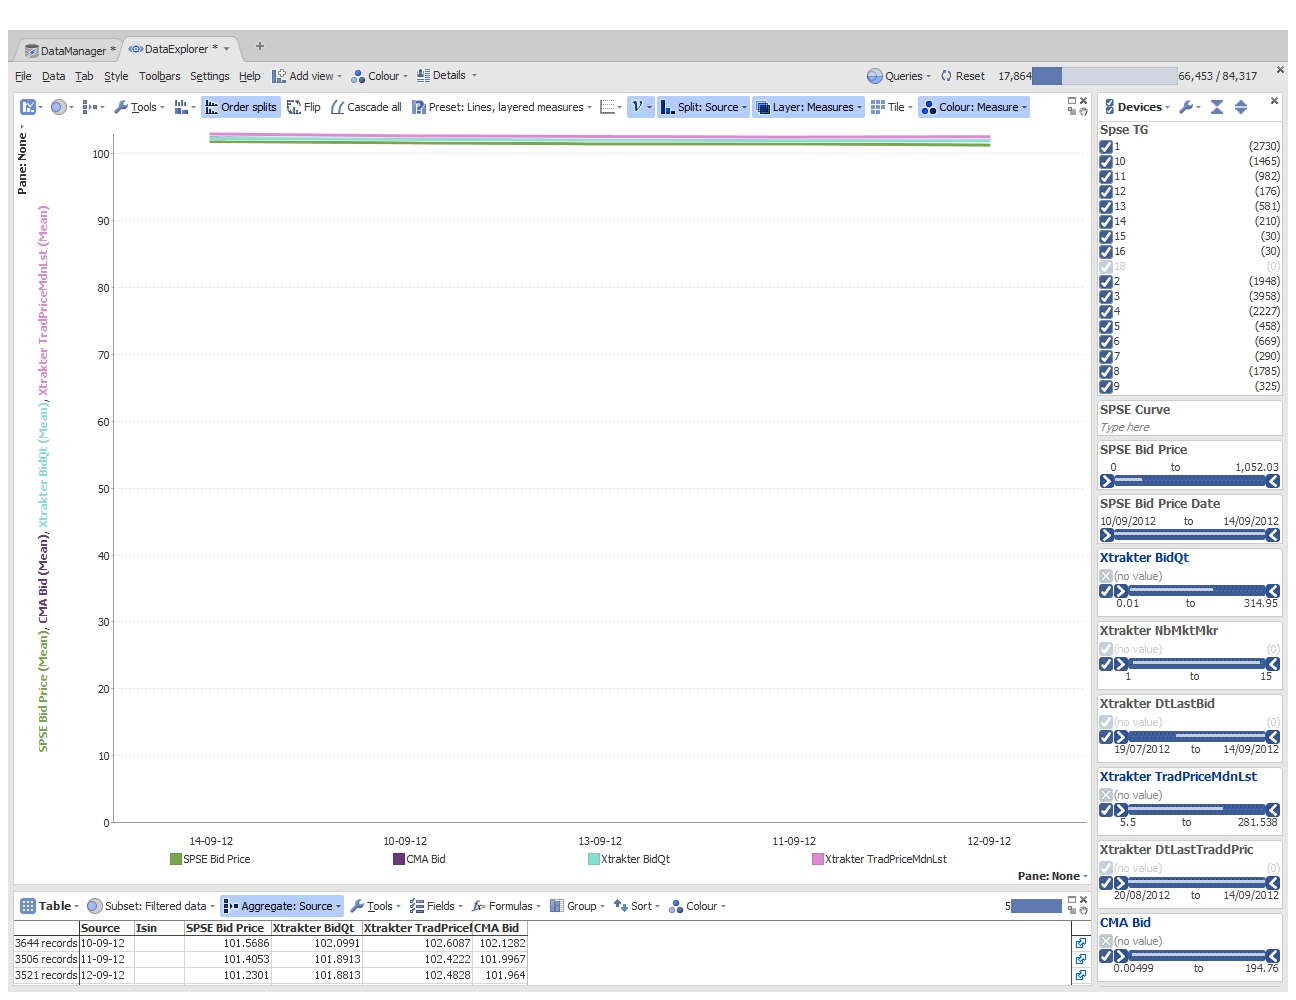
image1.jpg 799K -
Y axis custom range functionality will be available soon, with release of Omniscope 2.8.
In the meantime, you should use the Graph View, that will automatically adjust the Y range in a situation like this. You might have to use aggregation function to aggregate values for different categories. There is also an option to connect individual dots, where necessary.
-
I'm facing a similar issue on the plotting time dimension on X-axis of a Bar Graph.
The scale/interval is restricted to measure values unlike the Graph view where the time window can be configured by defining scope of view (using 'zoom')
Also, amending 'Interval' length under the split-menu doesn't seem to have an effect if the time-dimension measures are limited.
The filtering would override 'adding dummy values' tactical fix you've suggested above.


Welcome!
It looks like you're new here. If you want to get involved, click one of these buttons!
Categories
- All Discussions2,595
- General680
- Blog126
- Support1,177
- Ideas527
- Demos11
- Power tips72
- 3.0 preview2
Tagged
To send files privately to Visokio email support@visokio.com the files together with a brief description of the problem.