
Map Markers and hover plot options?
-
I have created markers with data on my map. I need help in either of the following solutions.
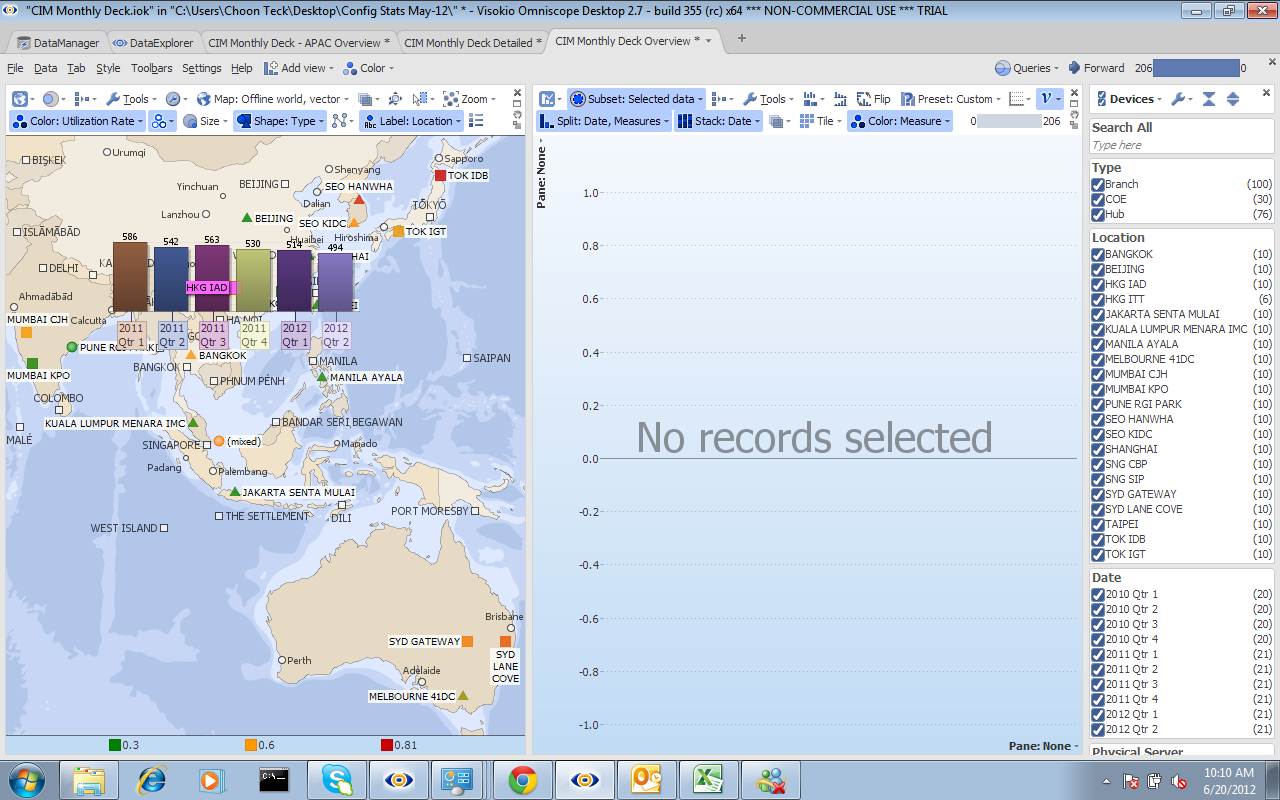
1. what i need is when i hover around the markers, bar charts on the right are shown in the map itself (shown in map2.jpg). how can i do it? the current hover portion only allows me to select one of the attributes in the data. how can i go around it?
2. the second solution i can think of is to link the line/bar chart view to the map. However, that will only works if i highlight over the marker. is there any way in the map that i can click on the marker and it links to the bar/line chart. Currently, the click brings me to the detailed rows of the selected data.
-
7 Comments
-
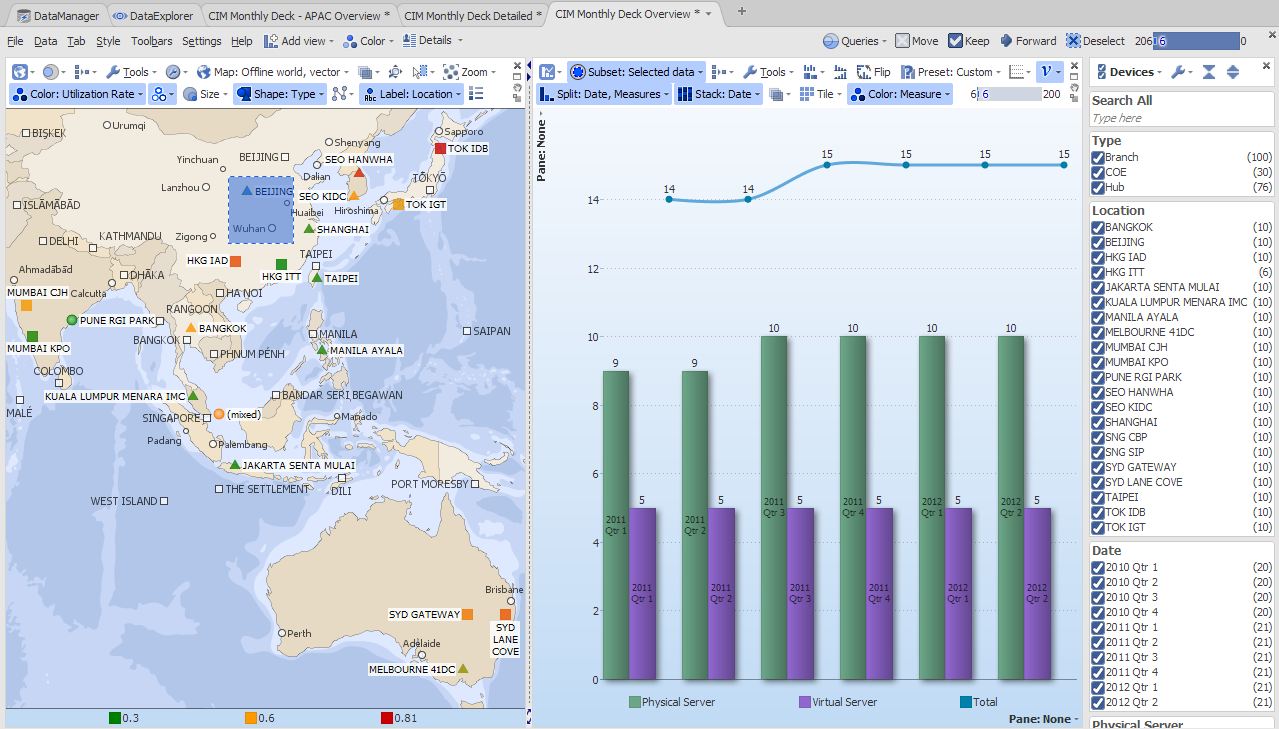
Hi Choon, the second option provides number of map select tools (square selector, lasso etc.), all of which will enable you to select one, two or unconnected clusters of markers. While your bar/line view has 'selected data' ticked, you will be able to see results for (only) the selected markers.
-
Hi Tjbate,
thanks. i reckon that my first suggestion was implemented currently. definitely something that we can look into to get more flexibility on the map hovering function.
Hi Paola,
i understand that we will be able to use the map select tools to select a cluster of markers where the data will be shown on my bar/line charts. However, would i be able to instead of using the map select tools, just click on the markers and get the selected data displayed on my bar/line charts?
Regards,
Choon Teck -
Hi Paola,
Yes, agree that the functionality is there.
my question would be whether it is possible that a click on the single marker brings about the bar/line charts?
Reason being, it would be more user-friendly for users to click rather than using the map select tools.
Regards,
Choon Teck -
Hi Choon, thanks for the input.
The reason we went for select tool is that it offers more flexibility - you can select one, two, or a dozen of connected/unconnected data points.
Click would limit you to one.
We could reclassify this as an idea and see if there is interest for this to change...


Welcome!
It looks like you're new here. If you want to get involved, click one of these buttons!
Categories
- All Discussions2,595
- General680
- Blog126
- Support1,177
- Ideas527
- Demos11
- Power tips72
- 3.0 preview2
Tagged
To send files privately to Visokio email support@visokio.com the files together with a brief description of the problem.