
Data Orientation: Month On Month changes - how to automate calculation?
-
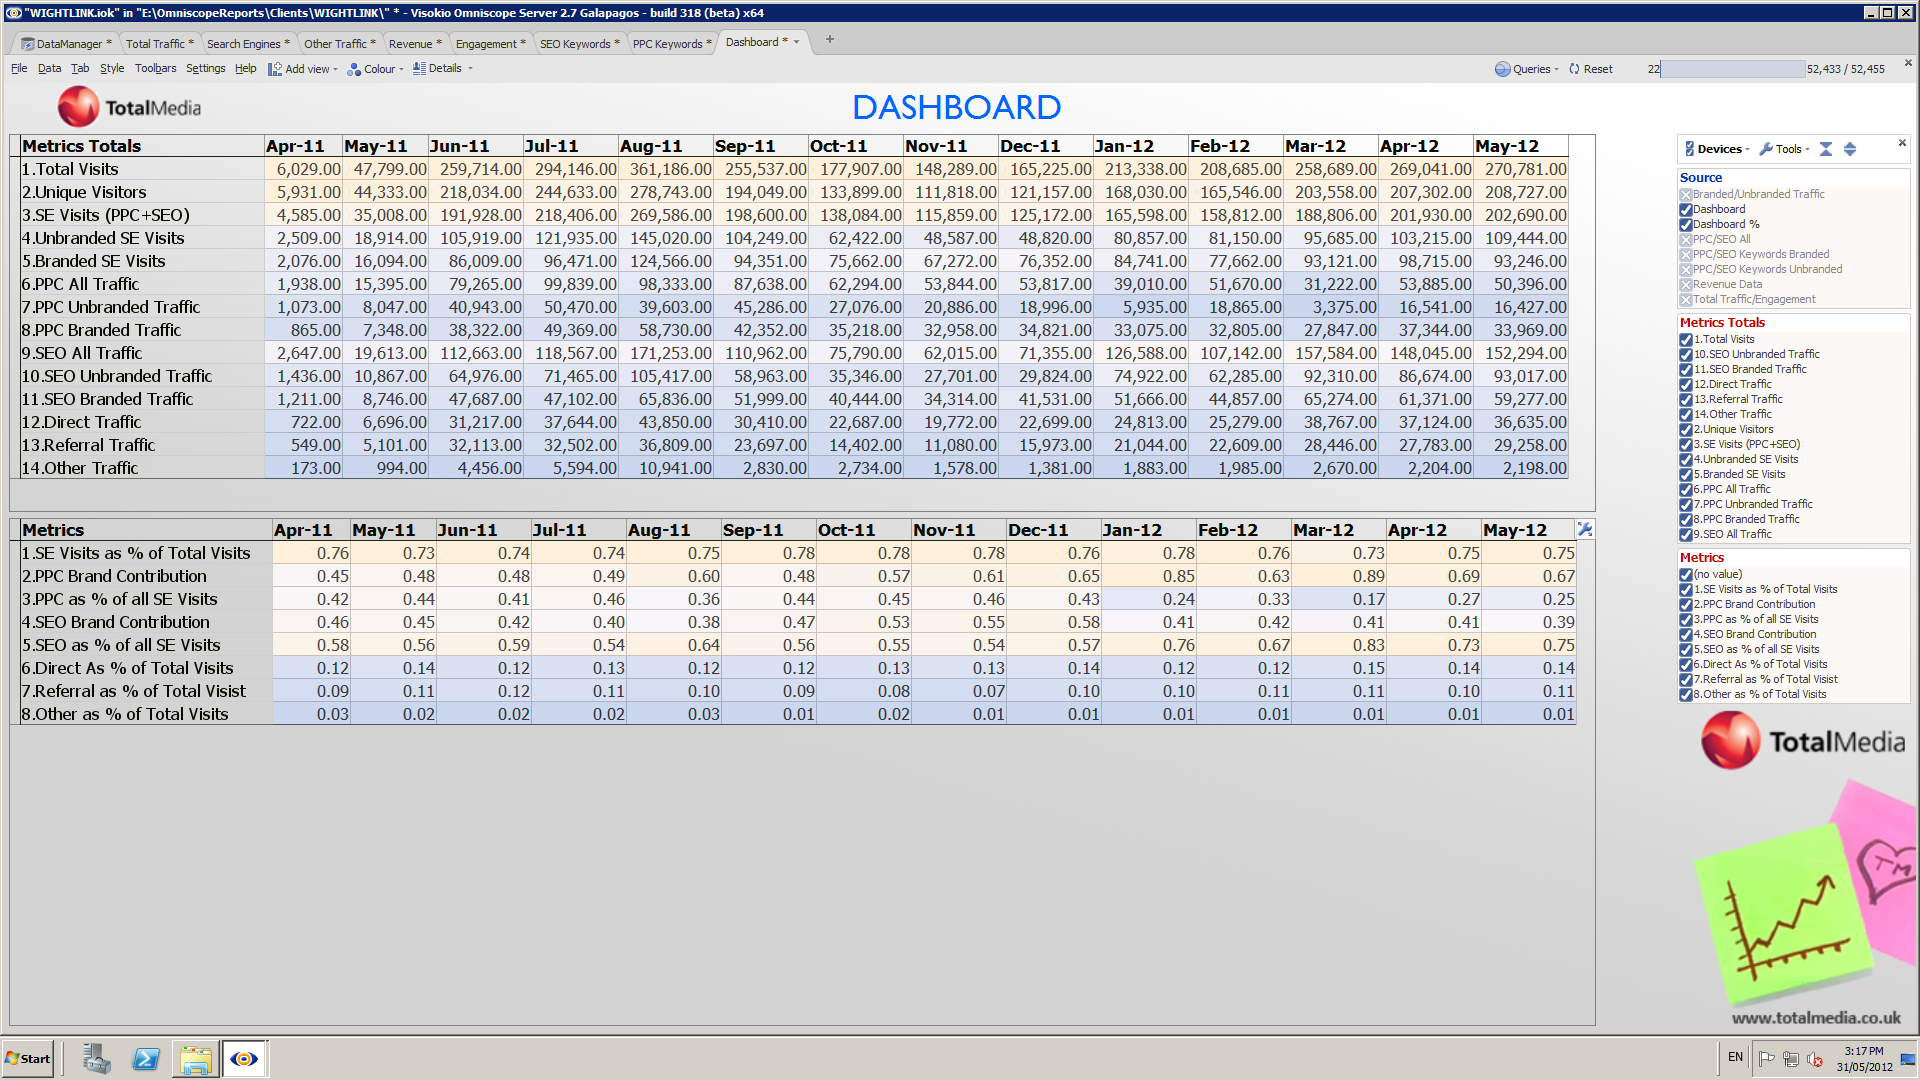
I created this dashboard (attached pic) and I would like to see month-on-month changes between only the last two months.
Is there a way to create a function which works on columns order numbers instead of columns names? I can add a function field but it will be working only for the months specified. I would like the function to work on the last two month always.
Is it possible?
Attachments
dashboard.png 439K -
14 Comments
-
See the REFVAL function
http://www.visokio.com/kb/functions-guide#REFVAL
Combine this with DATETOTEXT() and other date functions to lookup field values by dynamically-evaluated field names. -
I don't think I understand what the REFVAL function does. I don't know how to apply this function to my dashboard. What field should I use inside the function? "May-12" ? Could you help me to apply this function please?
Thanks -
REFVAL allows you to build up the field name using a formula, then retrieves the value for that field.
However you'd be better using a different data structure. De-pivot your data so it's like this:
Metric Month Value
1 Total Visits Apr-11 6029.00
1 Total Visits May-11 47799.00
etc.
This is a more common data structure. You can then use SUBSET_MAX([Month]) to determine the last month.
See: http://www.visokio.com/kb/subset-functions -
I have data in the format you suggested. Month field has date format. I added a formula field and applied the following formula:
REFVAL(MAX([Month]))
It comes with an error.
I still don't get it. -
Hi Dariusz,
Thanks for sending the file, I'll look into it. In the meantime please have a look at the sample attached, showing how to handle the horizontally aligned data, also formula to calculate month-to-month changes . Sample shows data transformation, graphic presentation and export. Explanation page will show on open, explaining operations step by step.Attachments
TimeSeriesMonthly.zip 39K -
Hi Paola,
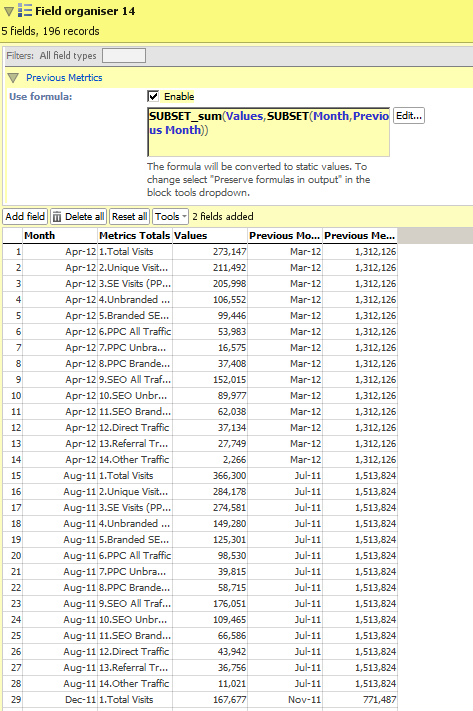
Thank you for looking into it. I tried to use the tricks from your example. The problem I have is that my data has more than just one metric (Sales) which means SUBSET_SUM formula adds all metrics and giving back the same value for all of them. Attachments
Example.png 40K -
Hi Dariusz,
If you have to select the Value for each unique combination of 3 fields (here Month, Metrics Totals, Values) you need to use theSUBSET3clause.SUBSET_SUM(Values, SUBSET3([Month],[Metrics Totals],[Previous Month])
This will give you one Value per unique combination of the 3 field values specified in the SUBSET3 clause, which you can use in further calculations.
Please note that if the two rows had the same value for Metrics Totals, then the Value in those two rows would be summed. As it is, each combination is unique, so no summing took place. -
The problem is that I have to present it in this way (attached pic) which is our client requierment. I don't see the way of transforming it to this format after applying your suggestions. It will look very messy with 10 different metrics. I am not interested in MOM changes for each month just for the last two month (always).
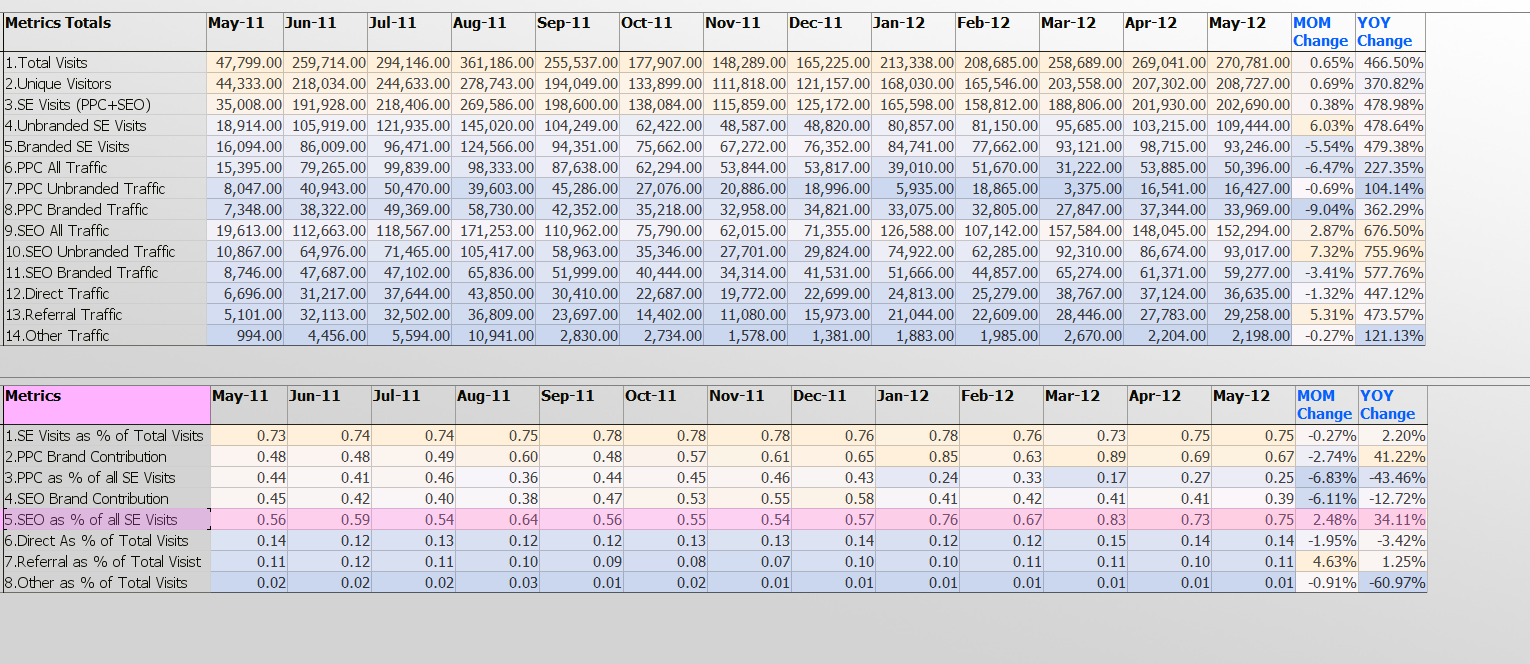 Attachments
Dashboard.PNG 251K -
Hi Dariusz,
Omniscope can calculate the difference between the last two values for all metrics, listed vertically in columns:[May-12]-[Apr-12])/[Apr-12]
The main issue is that you need vertical date orientation for your charts, and horizontal for the client's table.
The possible solution would be to append data and show on some tabs vertically aligned data with bar/line charts, and horizontally aligned data, as displayed above, can be shown in another tab.
Please see the video:
http://tc.visokio.com/videos/?name=DataManagerAppend&title=Append&lang=gb
-
Hi Paola,
My data has always last 13 months so next month I will have Jun12 and May11 will disappear. How the function will calculate MOM change between Jun12 and May12 automatically? Does it mean that every month I would have to manually change the calculated field and adjust it to the latest two months? -
Hi Visokio Team,
Did you have a chance to look at the file I sent you? Is it possible to create such function? I am still struggling with the problem.
Thank you -
Hi Dariusz,
the file you sent could not be refreshed and we could not recreate the problem with all the data.
If you need to automate this function, so Omniscope can automatically take away values for month n and (n-1), you could add [Month] value ranking column (Rank function) while the data is in vertical shape. On transpose, you could select the rank column (numbering your months from 1-13) to be in the header. That way your formula would always work and deduct last two values in the set. -
Thank you Paola, I will try this and let you know.


This discussion has been closed.
← All Discussions Welcome!
It looks like you're new here. If you want to get involved, click one of these buttons!
Categories
- All Discussions2,595
- General680
- Blog126
- Support1,177
- Ideas527
- Demos11
- Power tips72
- 3.0 preview2
Tagged
To send files privately to Visokio email support@visokio.com the files together with a brief description of the problem.