
Subset formulas - calculating % of Total per category
-
Hi,
I have survey data and i want to show data by the percentage of control and exposed respondents. The data is categorical.
Column A; Column B; Column C
Respondent 1 ; Control; Competitor A
Respondent 2 ; Control; Competitor B
Respondent 3 ; Exposed; Competitor C
Respondent 4 ; Exposed; Competitor A
Respondent 5 ; Exposed; Competitor B
Respondent 6 ; Exposed; Competitor C
The chart needs to show two bars for Competitor A, one control and one exposed. Control would be 50%, Exposed would be 25%. For competitor B it would show Control 50%, Exposed 25%. For competitor C it would show Control 0%, Exposed 50%.
Any idea how to do this?? -
8 Comments
-
Sure - you can use the formula below to calculate the values, then format the field as % (under Data>Manage fields >Options)
SUBSET_NONEMPTYCOUNT([Column B], subset2([Column B],[Column C]))
/
SUBSET_NONEMPTYCOUNT([Column B], subset([Column B]))
More about the SUBSET functions on this page http://www.visokio.com/kb/subset-functions
File attached.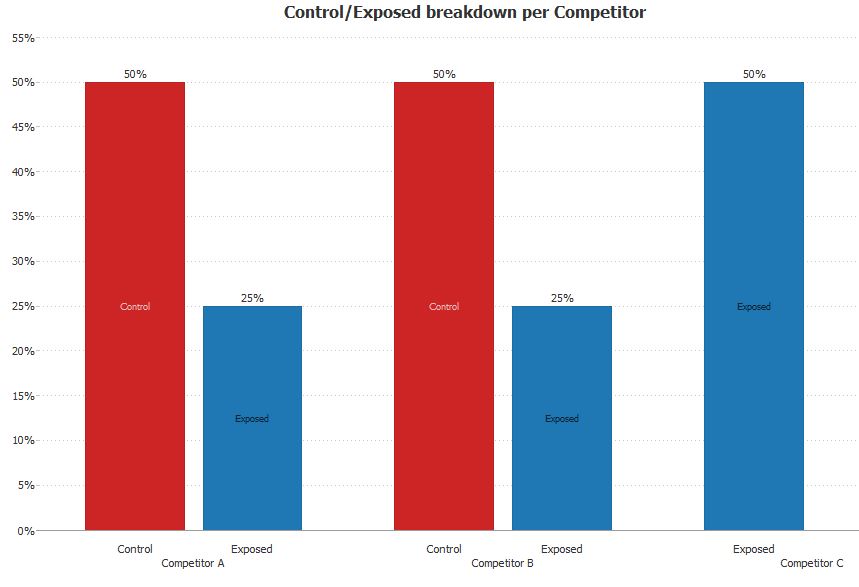
*Note about the principles of data visualisation - the chart in this format is not displaying the best principles of good data visualisation as the % numbers are not really obviously pointing to the entity that represents 100%, so in this case 50% for different competitors will appear as equal shares, while in reality they might represent different values.AttachmentsCompetitors.JPG 47K 
subset_Formula.iok 11K -
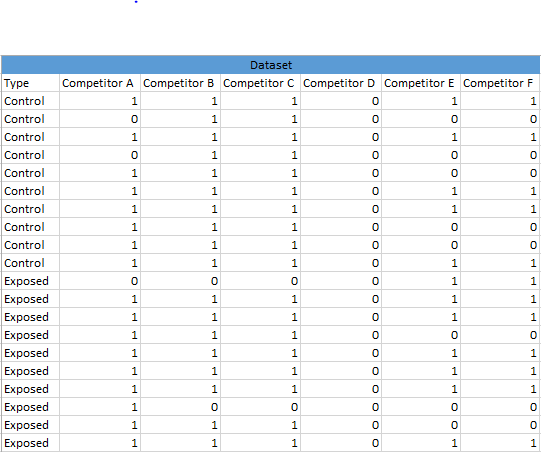
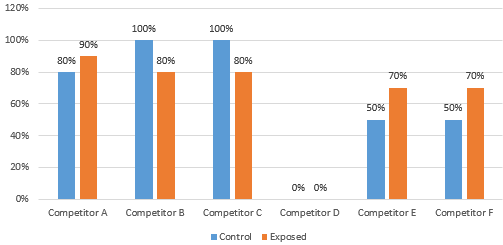
Hi - I have another question. Some of my survey data is formatted differently, as users are allowed to select multiple answers for a single question. We've broken out these answers into multiple columns with 1's or 0's. Respondent 1 chose Competitors A, E, and F. Respondent 2 chose Competitors B and C, etc. Please see the attached data file with the dataset and the graph I'm trying to create out of it. Please let me know the best way to create this.
Thanks!AttachmentsSurvey Question Data - Multi-Punch.xlsx 15K 
dataset.PNG 14K 
chart.PNG 11K -
There are different ways to organise data orientation for your file, but if you wanted to keep it 'as is', you could use formula to create a TOKENISED field, that will contain multiple searchable values, summarising multiple choices (e.g. A, B, E) in the same cell.
IF([Competitor A]>0,
FIELDNAME(2),
null)
+
","
+
IF([Competitor B]>0,
FIELDNAME(3),
null)
etc.
Select under Data>Manage fields>Options>Tokenised
Result should look something like "Competitor A, Competitor E, Competitor X".
See a video about the tokenised values
http://tc.visokio.com/videos/?name=DataManagerTokeniseDetokenise&title=Tokenise+%26amp%3B+de-tokenise&lang=gb -
A useful demo file attached dealing with questionnaire data - responses about cosmetic products, demonstrating some good techniques for data mapping (translating coded values such as 0,1) into actual words you wish to use for analysis.
Field [Products used] is a tokenised field, containing multiple values for each respondent, enabling you to create some interesting views e.g. in the "Cross Tab" tab see a Pivot view, looking at frequencies, displaying which products are used together. How many users/total are consuming shampo + conditioner?
AttachmentsQuestionnaireReport.iok 309K -
Hello -
Now that I've tokenized the field, I'm having issues with creating a formula that will give me the % of total per category. For example, My data looks like this, where Column C is tokenised:
Column A; Column B; Column C
Respondent 1 ; Control; A|B
Respondent 2 ; Control; B|D
Respondent 3 ; Exposed; C|D|E
Respondent 4 ; Exposed; A
Respondent 5 ; Exposed; B|C
Respondent 6 ; Exposed; A|E
The chart I create needs to show for A, Control=50%, Exposed=50%. For B, Control =100%, Exposed=25%. For C, Control = 0%, Exposed =50%. For D, Control =50%, Exposed =25%. For E, Control =0%, Exposed = 50%.
Is there a formula that will let me create that chart off of the tokenized field? -
Tokenised fields contain multiple values, but when used in a formula - the formula cannot return multiple values, one for each of the cell contents...
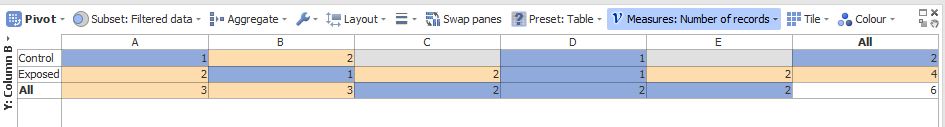
For this kind of calculation you can refer to the previous version and data orientation.
This version will easily create a cross tab showing in absolute numbers how much each combination of Columns B and C contributes towards the total (either the Control/Exposed or the A,B,C breakdown). Attachments
crossPivot.JPG 29K

Welcome!
It looks like you're new here. If you want to get involved, click one of these buttons!
Categories
- All Discussions2,595
- General680
- Blog126
- Support1,177
- Ideas527
- Demos11
- Power tips72
- 3.0 preview2
To send files privately to Visokio email support@visokio.com the files together with a brief description of the problem.