
Bar/Line View: Showing & labelling differences?
-
Hi
I wonder if anyone has come across this? To make charts more engaging to an audience, I want to spell out the message to them. So I have some data that has 2015 vs 2014, and what I want to do is have a label within these bars showing the values - easy enough.
Where I get stuck though is trying to show a Variance/Difference formula value that shows the difference between the 2 bars in the chart.
Attached is an image of my chart (with no labels). In summary, I don't want to show the difference formula purple bar, but I do want to show it's value in between the green and blue bars.
Any help would be great, if this is not possible than maybe an idea in the future as most dashboards I see have this as a view.
Cheers
DannyAttachments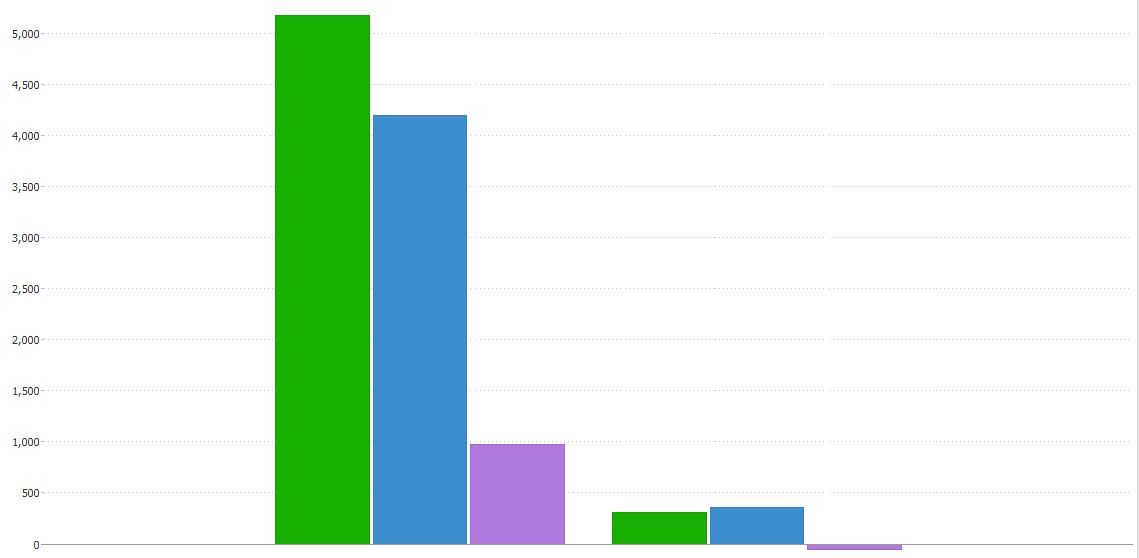
Difference Chart.JPG 43K -
1 Comment


Welcome!
It looks like you're new here. If you want to get involved, click one of these buttons!
Categories
- All Discussions2,595
- General680
- Blog126
- Support1,177
- Ideas527
- Demos11
- Power tips72
- 3.0 preview2
Tagged
To send files privately to Visokio email support@visokio.com the files together with a brief description of the problem.