
Bar/Line View: Displaying flat Average Line?
-
3 Comments
-
This could be achieved by adding a formula field in the Table view (or upstream, in the DataManager), creating the dynamic line that will always be up-to-date, something like
SUBSET_MEAN([Value], SUBSET([Period])
If you were to use the same formula inside the Bar/line view, as a measure function, the value would be correct only if you have histogram-type split e.g. Jan-Mar, Apr-June etc.
as every period will have a different mean, however this will not create a flat line across the chart, while the first option will. Under the Measures menu you should choose the Mean function for this field.
-
Hi Paula
The first idea won work because i want the mean value to update if the user select a wider or narrow date range on the RHS filters on the tab, or indeed if they filter by any other metric on the RHS
Also i want the average flat across the graph independant of the split.For instance split share price by date i would want the average over the date range rather then the average per day
-
You will need to introduce 2 variables, for start/end dates and use them in the formula field.
SUBSET_MEAN([Value],
SUBSET2([Date],[Date],[Start date],[End date],">","<"))
Demo file attached.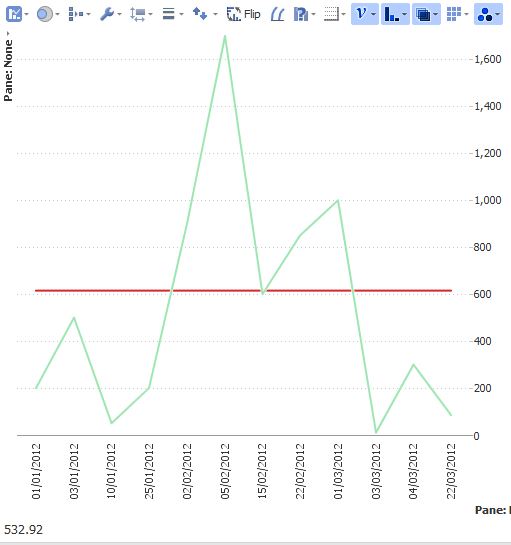 Attachments
FlatMean.JPG 36K 
2VariablePeriodCalculus.iok 23K


Welcome!
It looks like you're new here. If you want to get involved, click one of these buttons!
Categories
- All Discussions2,595
- General680
- Blog126
- Support1,177
- Ideas527
- Demos11
- Power tips72
- 3.0 preview2
Tagged
To send files privately to Visokio email support@visokio.com the files together with a brief description of the problem.