
Keeping axis on bar graph at same height
-
I would like to force the x axis of a bar chart to stay at the same position, regardless of the values being displayed, so that when I show the data as a time series, I get an effect like a graphic equailizer.
Is that possible? I attach a file showing example of what happens just now, that is, the x-axis moves up and down, depending on the size of the largest negative and positive values.
Many thanks
Keith GuthrieAttachments
visokiorequest.doc 205K -
20 Comments
-
I have achieved close to what I want by adding a dummy dataset containing the maximum and minimum value I want to show, then removing the border, shadow and gradient fills from the display and setting the colour for the max and min value to white. All I need to do now is work out if I can remove the numbers from the tops of the columns, do that I dont leave "hanging values". By calling my maximum and minimum data !Max and ZMin I force them to be the first and last values.
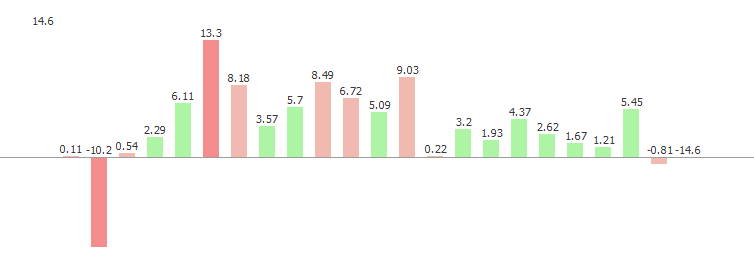 Attachments
equaliser.PNG 10K -
You can hide the labels at the top of the bars by selecting "Tools > Layout > Show measure labels at top of bars" in the Bar view toolbar. However, in certain cases it wasn't working which I have fixed in tonight's release. The fixes should be available from 2.6 build 503 or later.
-
I hadn't considered cropping high/low value ranges - to do that you would need to set up a column with an if clause that replaced the "real" value with the "Max" or "Min value if it exceeded it or went below it - also 0 needs to be in the range to be dsiplayed, though I guess you could subtract a constant from each value........
-
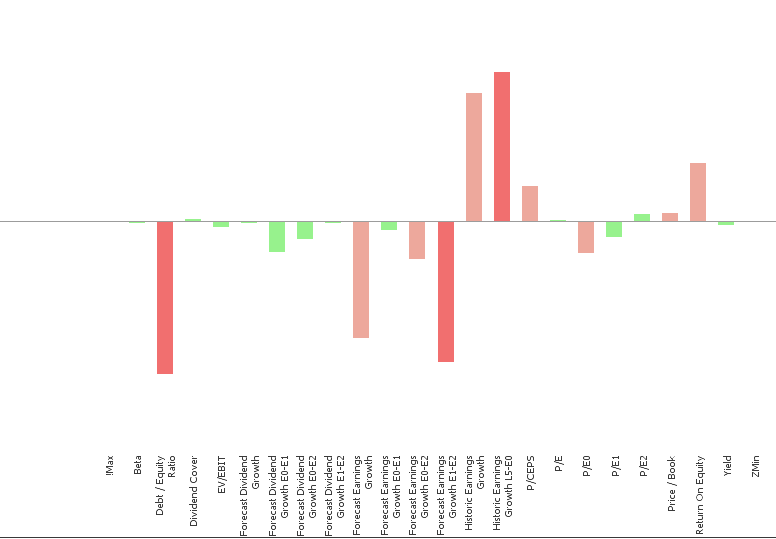
To achieve the same result in 2.6 5.04 (where I managed to hide the numbers at the top of the columns) I had to use a white "background" .jpg file, to prevent Visokio "helpfully" forcing outlines round the white bars - it does that for white on white. The .jpg fools it.
 Attachments
Capture6.PNG 19K -
See also the following duplicate requests, currently accounting for 5 further votes:
http://forums.visokio.com/discussion/575/ability-to-specify-or-fix-maximum-y-axis-values-for-bar-charts/p1
http://forums.visokio.com/discussion/1350/fixing-2-differnet-y-axis-value-ranges-independent-of-the-data/p1 -
-
NB. 2.8 is now available to alpha partners - see here:
http://forums.visokio.com/discussion/1671/omniscope-2.8-alpha-now-available-for-private-testing


This discussion has been closed.
← All Discussions Welcome!
It looks like you're new here. If you want to get involved, click one of these buttons!
Categories
- All Discussions2,595
- General680
- Blog126
- Support1,177
- Ideas527
- Demos11
- Power tips72
- 3.0 preview2
To send files privately to Visokio email support@visokio.com the files together with a brief description of the problem.