filtering a chart in the data viewer
-
I am viewing the data in the viewer adn it is organised by different dimensions. in particular i am looking to filter all charts by value of a single transaction or interval value how can I do that? (transactions are over 100000s)
how can I apply a filter?
i was able to create a chart with the individual transactions value in case i cannot set up a filter and then select manually the subset of data however i have another problem which is how can I select a large amount of data by autoscrolling all charts? -
5 Comments
-
Thanks Steve,
Because of the sensitive information i cannot share the entire screen
i am using the viewer only so i have little edit rights
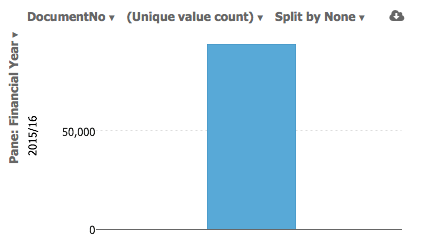
i have a chart where I have the total unique count for all invoices (file 1) i was wondering if i could by using the filtering above the chart reduce that to the total only for invoices between 500 and 500000
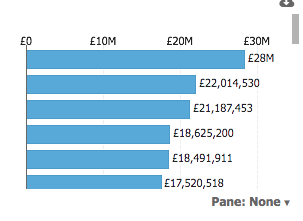
otherwise i changed a near by chart (file2) to reproduce the amount by invoice(each bar is a single invoice) and use it as a filter but because i cannot scroll down automatically to select the interval i need and therefore impact all the other charts including the one on (file1)
what can I do? -
Giulio, the Viewer allows you to use whatever views and devices are on-screen. But you can't configure new devices. In this case whoever authored the IOK file didn't set up filter devices. If they had, you'd be able to filter (typically a list of checkboxes and sliders in a side bar on the right). The devices you mention in file1.png are drop-downs for changing the view breakdown field, etc.
-
understand
thanks Steve, there are some filters on the side But not sure i have the slider you mean on the value of single invoices.
i can use a second chart that i created on the single invoice value to select the interval, the problem is the non autoscrolling function. It is very playful to select a list of 100s of bar chart is there a setting i can activate to enable autoscroll?
Welcome!
It looks like you're new here. If you want to get involved, click one of these buttons!
Categories
- All Discussions2,595
- General680
- Blog126
- Support1,177
- Ideas527
- Demos11
- Power tips72
- 3.0 preview2
Tagged
To send files privately to Visokio email support@visokio.com the files together with a brief description of the problem.


