Create custom groups in Omniscope
-
When faced with situation that one record can belong to the multiple groups, the challenge is how to visualise, compare and present the data, without double-counting or exclusion.
In Omniscope, each cell can contain multiple values, that can be independently queried, grouped, used for calculation or visualised. The feature is called tokenisation and you can select it in different locations:
• Data Manager>Field organiser>Field options
• Data Manager > Tokenise block, see video http://tc.visokio.com/videos/?name=DataManagerTokeniseDetokenise&title=Tokenise+%26amp%3B+de-tokenise&lang=gb
• Data>Manage fields > Field options >tokenised
• Data Explorer > Table view> right-click on the Field name >field options > tokenised
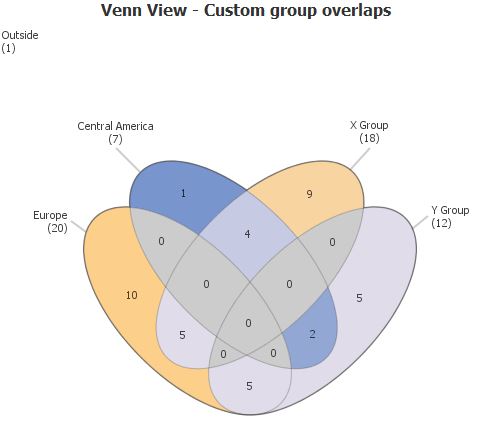
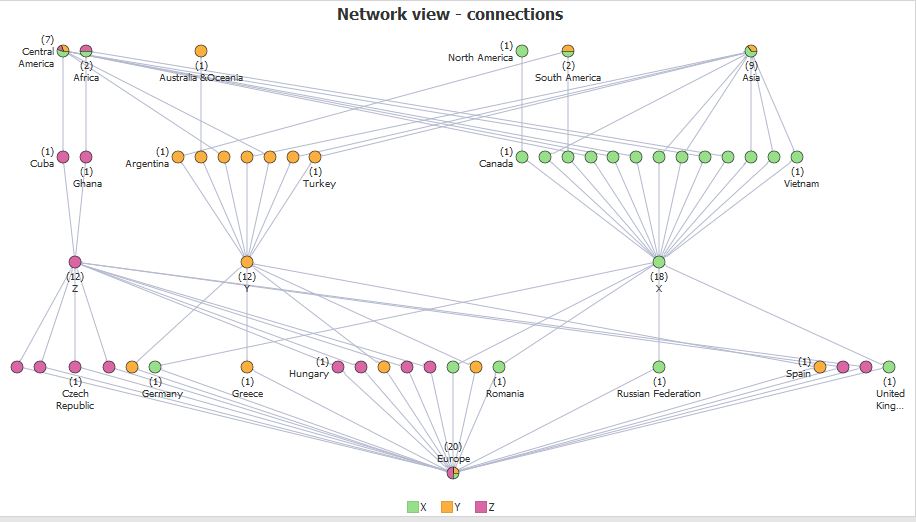
Here are few ideas how to visualise a similar scenario. Probably the best way to visualise multi-group belonging is the Venn view, which can be connected to other views to create an interactive story… Network view can also be useful - see the attached iok file.
Network view is showing double- hierarchy: Attachments
Venn.JPG 24K 
Network_DoubleHierarchy.JPG 66K 
CountriesGroups.iok 31K
Welcome!
It looks like you're new here. If you want to get involved, click one of these buttons!
Categories
- All Discussions2,595
- General680
- Blog126
- Support1,177
- Ideas527
- Demos11
- Power tips72
- 3.0 preview2
To send files privately to Visokio email support@visokio.com the files together with a brief description of the problem.

