BCG Matrix
-
Hi
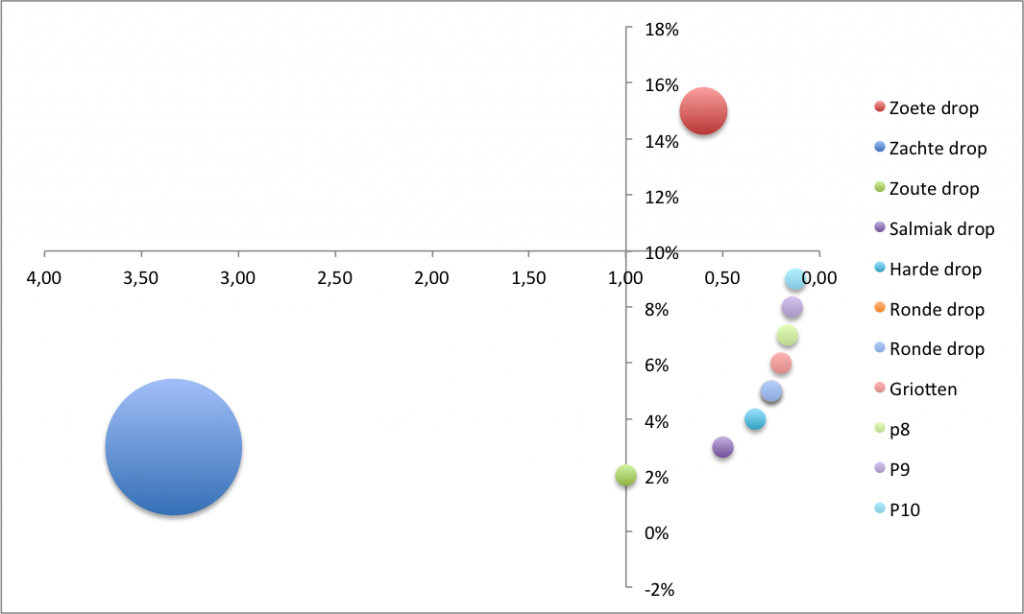
We try to create a BCG matrix.
It needs an x-axis that has zero on the right and ascending numbers to the left.
Is this possible in Omniscope?
I have attached an example
Many thanks
ArjanAttachments
uitwerking-BCG-matrix-1024x614.png 123K -
1 Comment
-
You could use the Graph view's Zoom>Specify custom zoom region
to extend the X/Y axis to show the required range, however it would not be possible to force the Y axis to run through -1 on the X axis.
Instead you could use the guidelines or zones under the Stats menu.
Welcome!
It looks like you're new here. If you want to get involved, click one of these buttons!
Categories
- All Discussions2,595
- General680
- Blog126
- Support1,177
- Ideas527
- Demos11
- Power tips72
- 3.0 preview2
Tagged
To send files privately to Visokio email support@visokio.com the files together with a brief description of the problem.


