
Bar/Line view: Can I plot multiple measures on separate axis?
-
Hi there,
I'm comparing website competitor metrics on a line graph, and one of them has such a big share that it compresses all the other series so that they're unreadable. I still want to show all websites on the same graph, is there a way I can ask for just this one series to be plotted on a separate graph, so that the others can be seen (I am aware that graph-readers will now need a caveat as the series won't be quite proportional to each other). Thanks very much! -
1 Comment
-
Bar/line view allows you to select from the Preset menu options: "lines on bars", "markers on bars" or "lines, layered measures", then use the Measures menu to select settings for each measure - whether it is represented by a line/bar/marker, which function will be used (mean, sum etc.), which scale to plot it on, as well as styling and labelling etc.
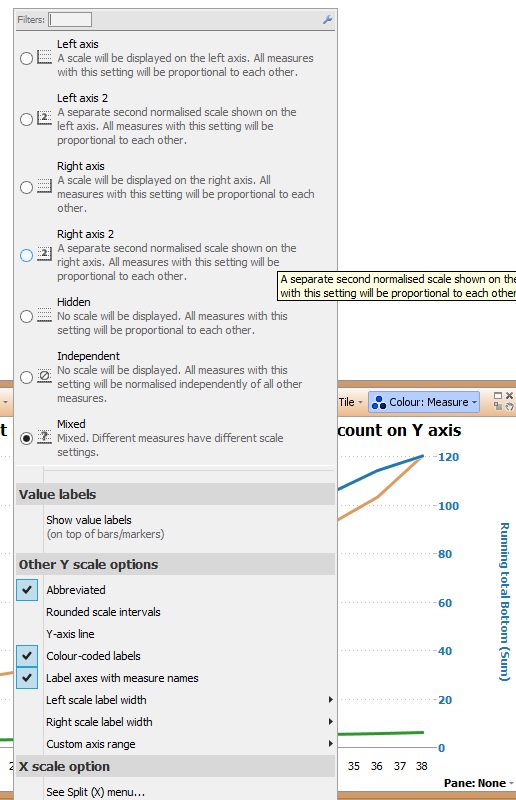
Further to that, the Scale menu offers further scales formatting and data labelling options, please see the images.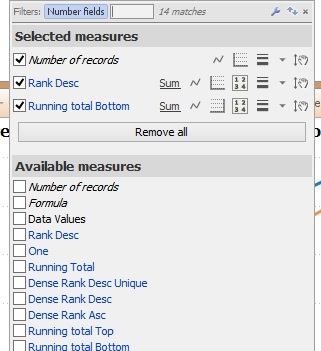
 Attachments
measuresMenu.jpg 35K ScalesMenu.jpg 112K

Welcome!
It looks like you're new here. If you want to get involved, click one of these buttons!
Categories
- All Discussions2,595
- General680
- Blog126
- Support1,177
- Ideas527
- Demos11
- Power tips72
- 3.0 preview2
Tagged
To send files privately to Visokio email support@visokio.com the files together with a brief description of the problem.