
Bar/Line View: creating different time intervals
-
Hi,
I work with Data Manager and with Omniscope Dashboard like a beginner.
I need to help with these visualization:
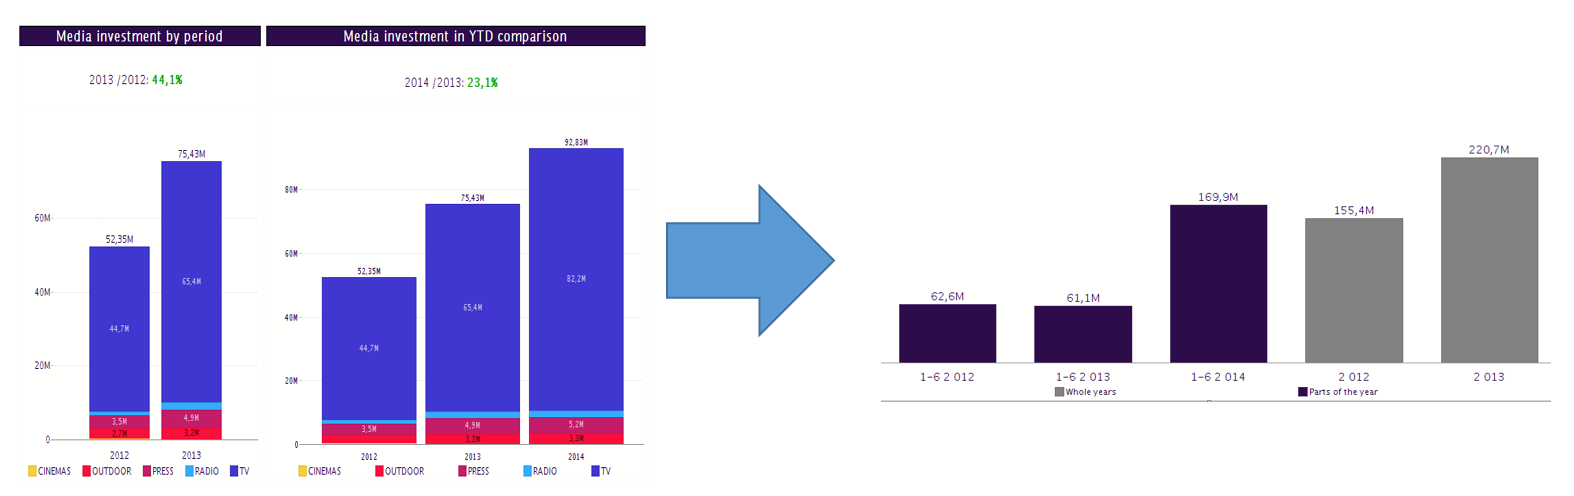
I need to show two complete years on left and two periods from year for example 1-6 2014 and 1-6 2013 on the right side. Something like on my example.
Can you help me, how can I do this? Thank you for your help.
Attachments
Something like that.png 69K -
3 Comments
-
If you wish to have multiple views in the same tab, displaying different 'time-slices', you can change the time frame in the Split menu to create either split by unique period or by different intervals.
In this case you are using [Date] field to split the data, so please click on the Histogram option (see image), and then on the Interval to create your 6-month or annual bars.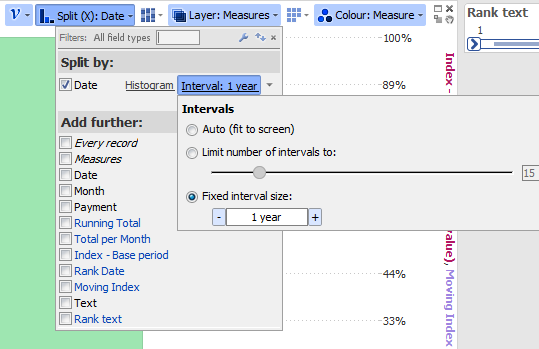
You can also use queries to create views that might be displaying different datasets, for example different years.
See how to achieve this: http://tc.visokio.com/videos/?name=SavedQueriesAndSubsets&title=Saved+queries+%26amp%3B+subsets&lang=gb
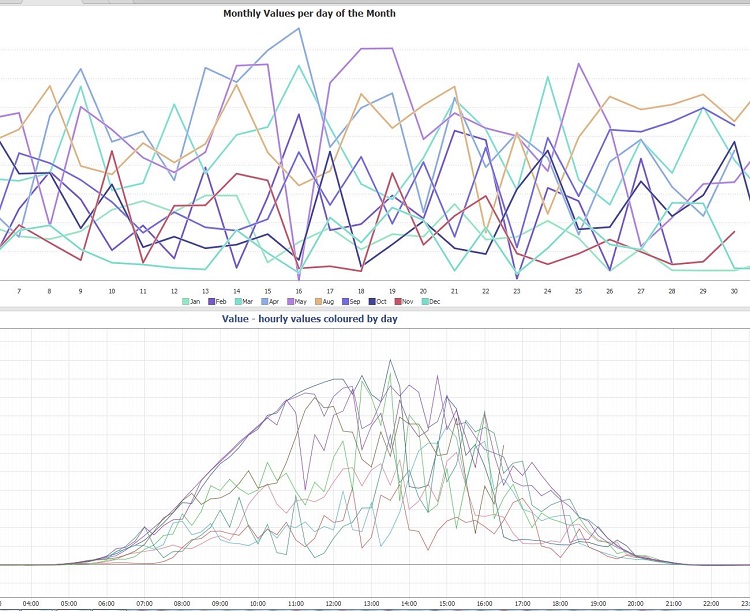
Another useful feature is layering option in the Bar/Line view, using the line mode for the measures, where you can have split by [Month] field, layering by [Year], to establish whether for example Q4 was stronger in 2013 than 2014 and follow it further into the new year. Attachments
Split menu.png 20K TimeSplits.JPG 167K -
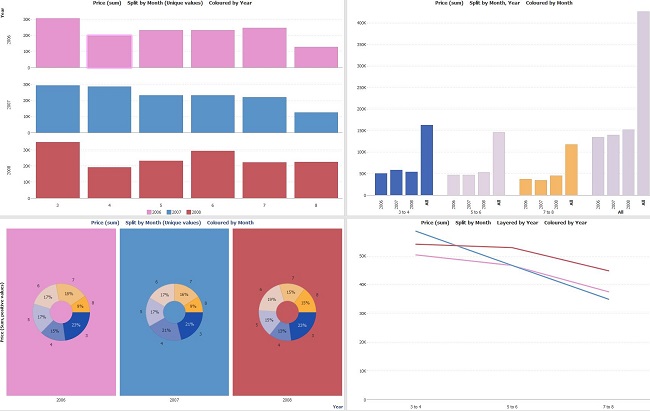
Omniscope will allow you to create bi-monthly or 6-months split intervals, also display them next to the relevant totals (in the Split menu you can select the option "All data"). You can also have multiple-split fields (see the top RH corner view).
Please see the demo file that gives you few suggestions how to display the time series by using variations in Splitting, Panning, Layering... Attachments
splits.JPG 64K 
TimeSlicing.iok 61K

Welcome!
It looks like you're new here. If you want to get involved, click one of these buttons!
Categories
- All Discussions2,595
- General680
- Blog126
- Support1,177
- Ideas527
- Demos11
- Power tips72
- 3.0 preview2
Tagged
To send files privately to Visokio email support@visokio.com the files together with a brief description of the problem.