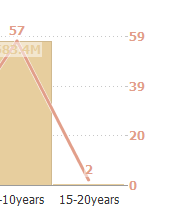
Bar/Line View: Strange axis scale problem?
-
Even after ticking the 'rounded scale intervals' option, the scale on some of my axes is weird. I've attached a photo - it shows 0,20,39,59 - clearly what I'd like is 0,20,40,60.
Is there anything I can do about this?
ThanksAttachments
Right axis strange scale.PNG 5K -
2 Comments
-
It is difficult to say without seeing the whole picture or the file, but I assume you have primary axis on the left-hand side, so when you click on that option 'rounded scale intervals' the intervals are rounded on LH side.
What Omniscope will then try to do is to keep the right axis in scale to the left, which might result in the odd figures on that side...
Please send the file if this is not the case (you can send it directly to support). -
Thanks paola - you guessed right. I think what I'd ideally like is that the right scale adjusts itself slightly (it's not important to me that the highest value from the left axis and the highest value from the right axis go up to the same height in the chart, which seems to be what's happening at the moment) so that it reads 20,40,60 - does that make sense? Is anything like that possible?
Welcome!
It looks like you're new here. If you want to get involved, click one of these buttons!
Categories
- All Discussions2,595
- General680
- Blog126
- Support1,177
- Ideas527
- Demos11
- Power tips72
- 3.0 preview2
Tagged
- Bar/Line_View102
- dual-axes12
- scale-axis4
To send files privately to Visokio email support@visokio.com the files together with a brief description of the problem.


