Export: Grouped Table View data to Excel?
-
Apologies if this has been answered elsewhere.
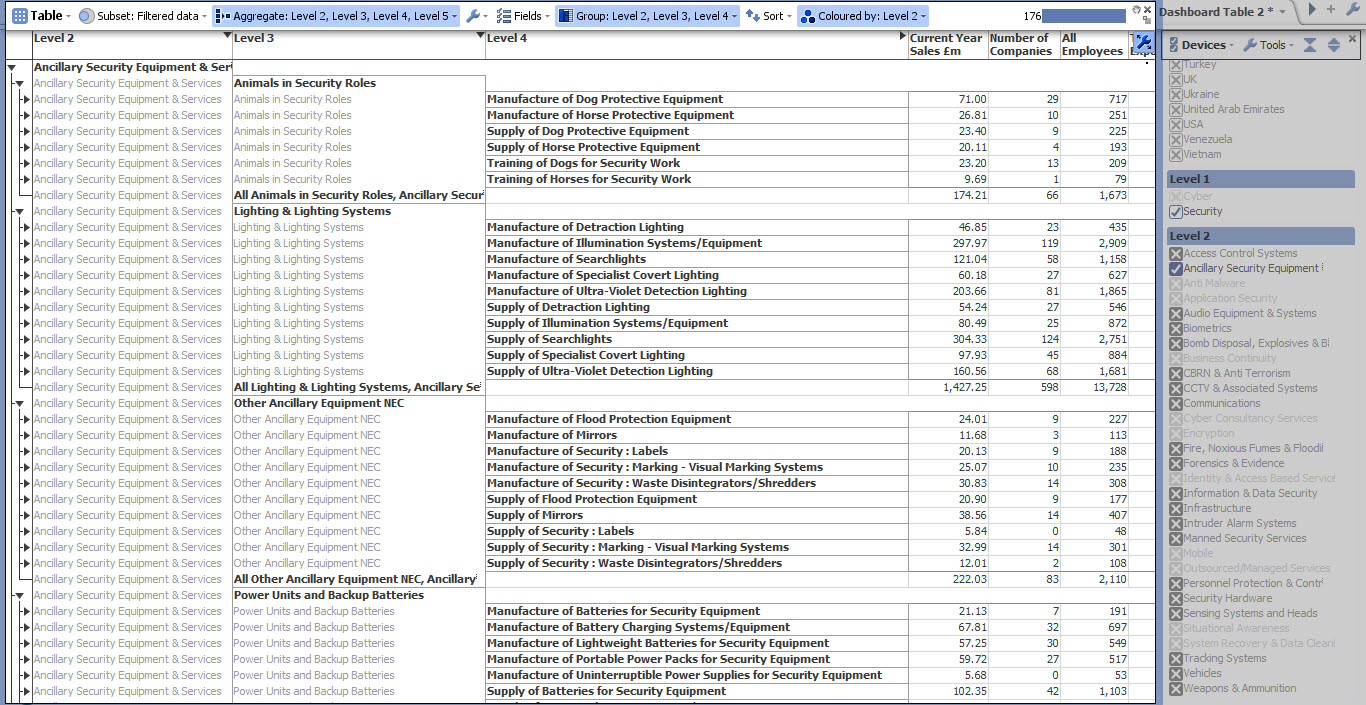
I have grouped and filtered data in table view. I have tried to export the data to Excel but lose the grouping.
Is there a way to export data to Excel and retained the grouping and sub totals?Attachments
sample 1.jpg 462K -
5 Comments
-
In the image I can see you've set aggregation grouping upto level 5, try undoing the level 5 aggregation and run the export data again.
Alternatively you can copy and paste out the data manually using Ctrl C + Ctrl V, though you will need to add the column headings manually.
-
Hi Daniel
If I take the level 5 aggregation off I just lose the level 5 values from the table and the export result is the same- no groupings
If I select all data and use Control C and Control V I get the same result- no groupings.
What next? -
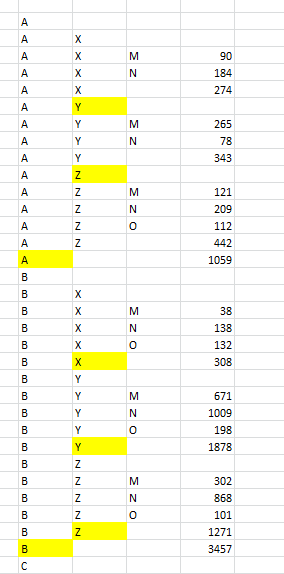
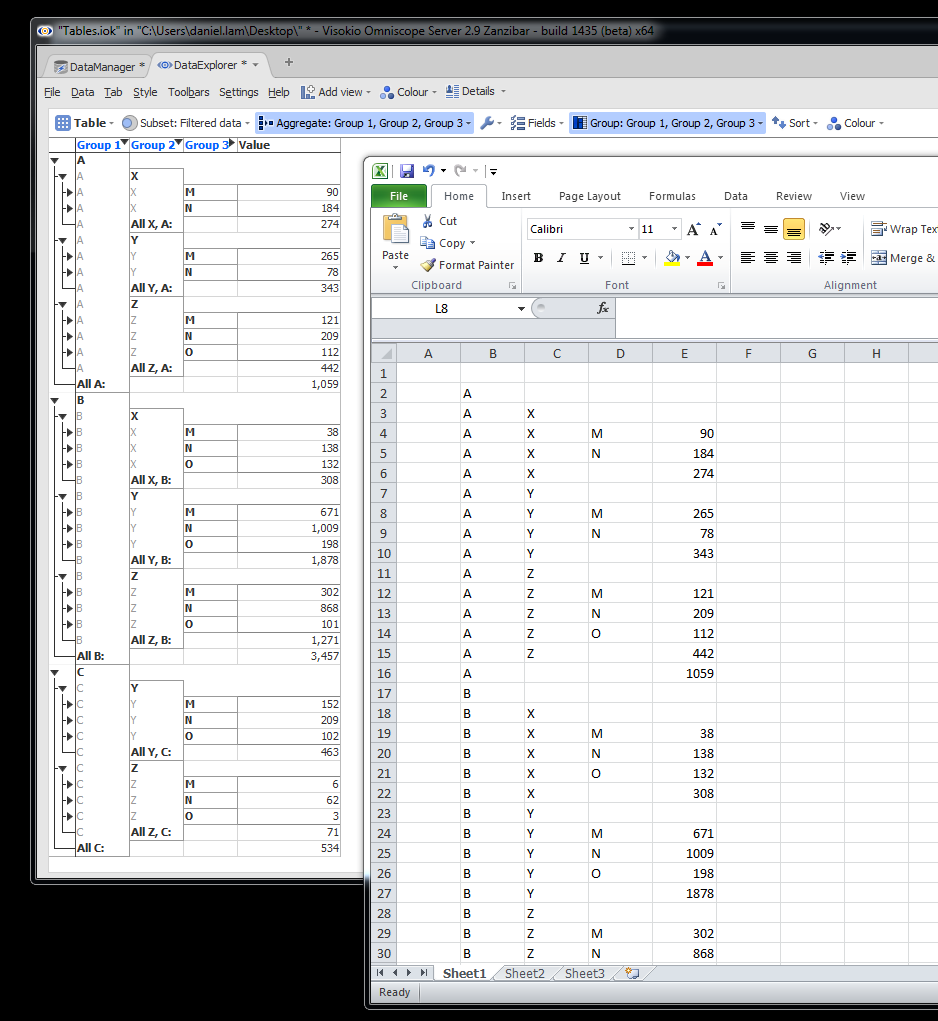
Well this is what I get if I copy and paste out of the table similarly set up.
I did mine in Omniscope 2.9 b1435
*EDIT: Were you specifically after the names "All..." by the subtotals for groupings and the actual borderings etc?
I can see in mine that actually it just names them by the value so you can't really see the subheadings clearly. I'm only really looking at the output table data, I don't think its possible to get the formatting & functionality identical to what is in the table view. Attachments
Grouped tables.PNG 106K 
Tables.iok 10K 
Groupings.PNG 11K -
Martyn: In Omniscope, Grouping is presentational, i.e. the user is meant to be able to roll-up and roll-down inside the view interface. This is different from Aggregation, which is an actual summing of the underlying rows.
When exporting data to another application like Excel, the grouping aspect of data presentation is lost. It cannot be transferred between the two applications automatically. The cut-paste method suggested by Daniel is closest you will get.
If you do not care about the users of the Excel worksheet being able to roll-up and roll-down in Excel, you can try using View Aggregation rather than Grouping.
-
OK, thanks.
Back to the drawing board
Welcome!
It looks like you're new here. If you want to get involved, click one of these buttons!
Categories
- All Discussions2,595
- General680
- Blog126
- Support1,177
- Ideas527
- Demos11
- Power tips72
- 3.0 preview2
Tagged
To send files privately to Visokio email support@visokio.com the files together with a brief description of the problem.


