
GIS: Geometric buffer operation
-
Omniscope's DataManager supports buffering of geographic shapes by applying a fixed distance to extend/contract the original geometry. For example, this could be used to generate a sales area around a shop using a Euclidean (straight line) distance in all directions.
Geometric buffers can be applied to 3 types of shape data in Omniscope;- Point - A dataset containing pairs of latitude/longitude coordinates, e.g. a shop location.
- Line - A dataset containing connected, and unfilled/unclosed, chains of points, e.g. a hurricane path or road.
- Area - A dataset containing connected, and filled/closed, chains of points, e.g. a post code area or country border.
Below are instructions for buffering these 3 types of shape data. Please download and extract the contents of the ".zip" file:
POINT- Create a new file in Omniscope and go to DataManager.
- Drag "United Kingdom cities.csv" onto the DataManager workspace. This contains 5 major cities in the United Kingdom with latitude/longitude coordinates.
- Connect a "Geometric buffer" operation to the workflow.
- Choose "Point" as the "Input data type". (For KML and Shapefile sources, this will be configured for you.)
- Enter a distance (km) to buffer around each input point. By reducing the "Quality" you will increase the speed of this block but the output dataset will contain less records and the buffered outline will not be as smooth.
- Check 'Include metadata' if you would like the output dataset to contain all other fields found in the input, i.e. "Country name".
- Execute the block, load the data into Omniscope and then drag a Map View into Omniscope to see the buffered points.


LINE- Create a new file in Omniscope and go to DataManager.
- Drag "Hurricane Katrina.csv" onto the DataManager workspace. This contains coordinates for the path of Hurricane Katrina in 2005.
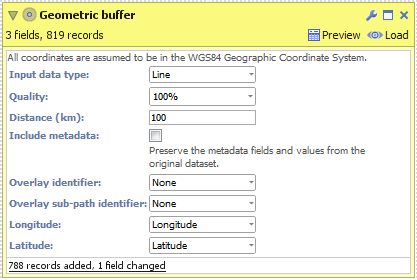
- Connect a "Geometric buffer" operation to the workflow.
- Choose "Line" as the "Input data type". (For KML and Shapefile sources, this will be configured for you.)
- Enter a distance (km) to buffer around the line (hurricane path). By reducing the "Quality" you will increase the speed of this block but the output dataset will contain less records and the buffered outline will not be as smooth.
- Execute the block, load the data into Omniscope and then drag a Map View into Omniscope to see the buffered line.

AREA- Create a new file in Omniscope and go to DataManager.
- Drag "United Kingdom.kml" onto the DataManager workspace. This contains coordinates defining a simplified boundary of the United Kingdom..
- Connect a "Geometric buffer" operation to the workflow.
- Ensure "Area" is selected as the "Input data type". (For KML and Shapefile sources, this will be configured for you.)
- Choose your method of buffering:
- Expand area - The original area plus an outside perimeter.
- Contract area - The original area less an inside perimeter.
- Outside perimeter - The area within a certain distance outside of the perimeter.
- Inside perimeter - The area within a certain distance inside of the perimeter.
- Outside + inside perimeter - The area within a certain distance either side of the perimeter.
- Enter a distance (km) to buffer around the United Kingdom. By reducing the "Quality" you will increase the speed of this block but the output dataset will contain less records and the buffered outline will not be as smooth.
- Execute the block, load the data into Omniscope and then drag a Map View into Omniscope to see the buffered line.


ADVANCED
The "Geometric buffer" block also contains additional controls for configuring which fields contain the latitude/longitude values and the fields for identifying individual features (shapes) in the input dataset. If you are using KML or Shapefile sources then these fields will be configured automatically. Below are explanations for each option:- Overlay identifier - Field containing unique identifiers for each point, line or area in the input dataset, e.g. a field containing country names or postal area codes.
- Overlay sub-path identifier - This is used internally within Omniscope to identify nested geometries within each shape. For example a shape for the United Kingdom could not be drawn with one continuous line. We use this field to breakdown the records into numerous islands which make up the country.
- Longitude - Field containing WGS84 longitude values.
- Latitude - Field containing WGS84 latitude values.
Attachments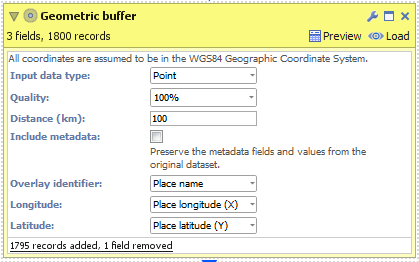
DataManager Block - point.png 15K 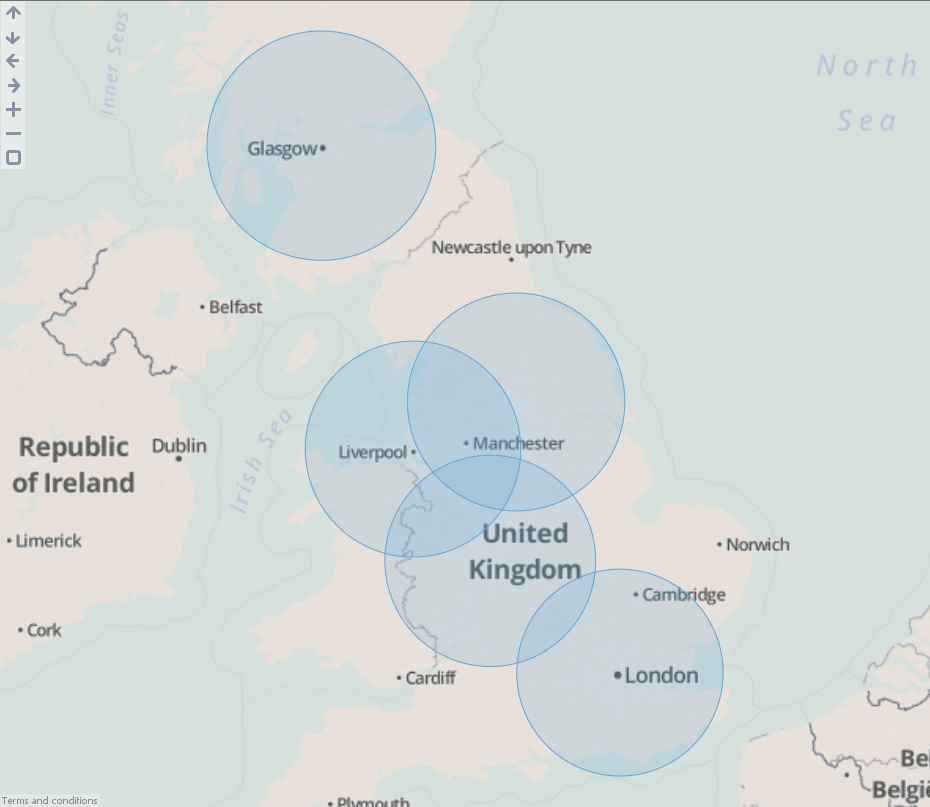
Map View - point.jpg 395K 
DataManager Block - line.png 15K 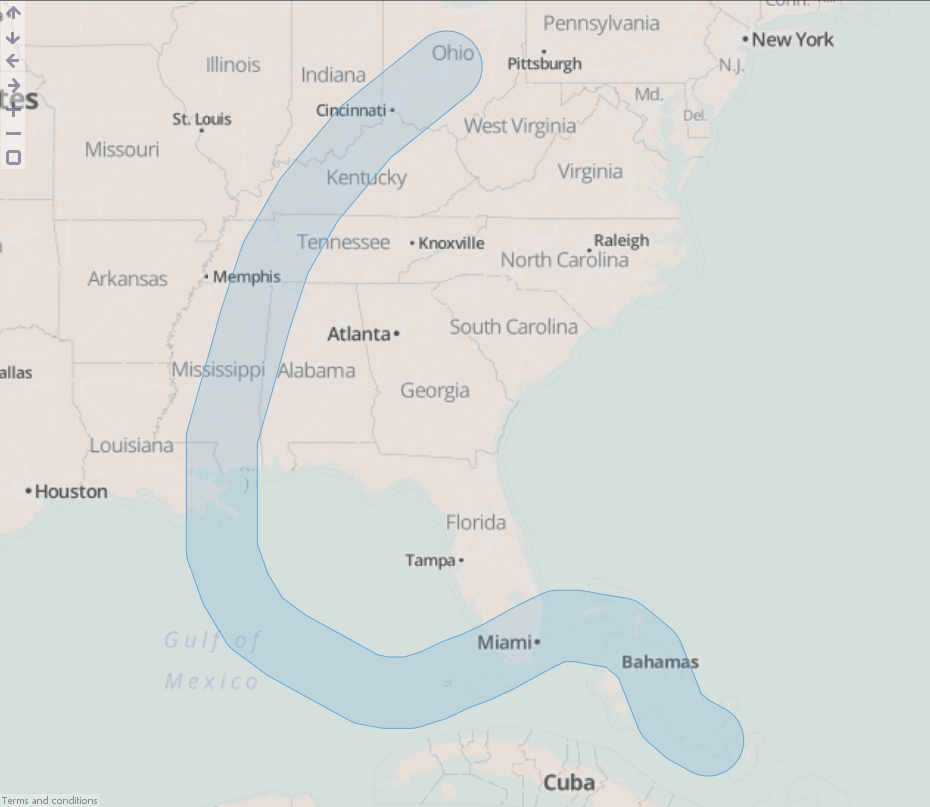
Map View - line.jpg 422K 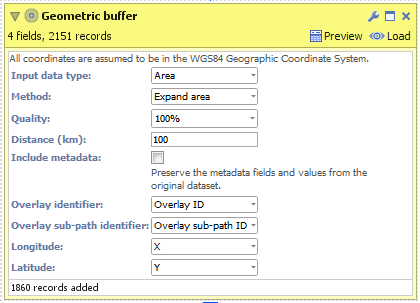
DataManager Block - area.png 16K 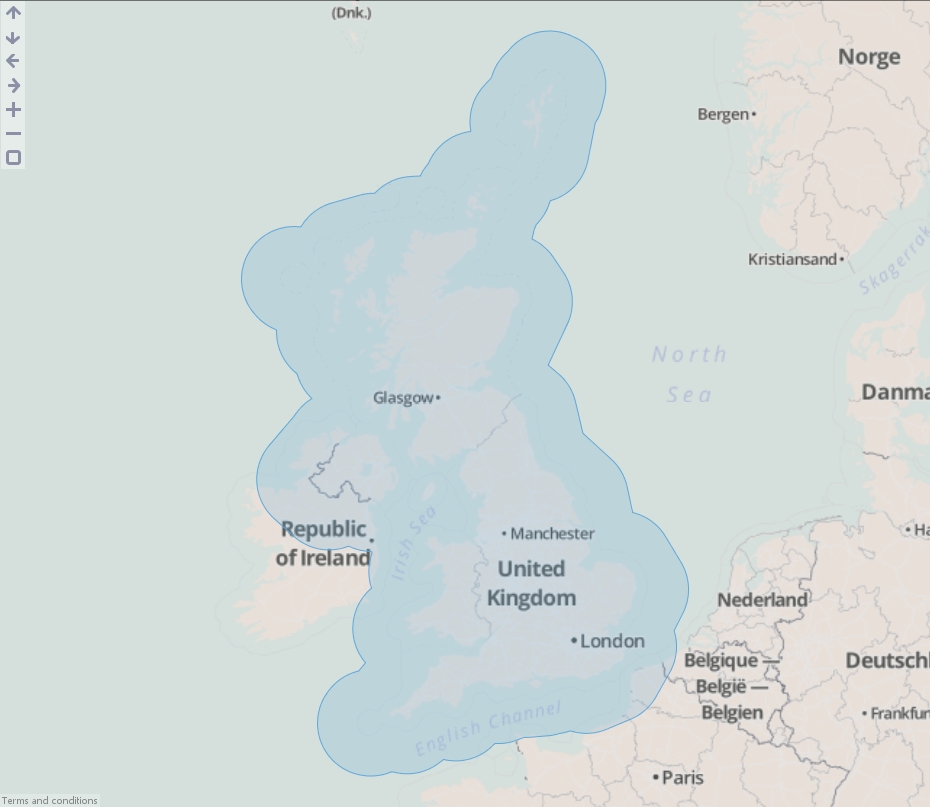
Map View - area.jpg 380K 
Shapes.zip 6K

Welcome!
It looks like you're new here. If you want to get involved, click one of these buttons!
Categories
- All Discussions2,595
- General680
- Blog126
- Support1,177
- Ideas527
- Demos11
- Power tips72
- 3.0 preview2
Tagged
To send files privately to Visokio email support@visokio.com the files together with a brief description of the problem.