Pivot View: Running YTD Total Across Columns?
-
Is it possible to do a running total across a pivot table? I want to aggregate spend across a number of periods along the x axis split by a year in the y axis? The years and periods are dynamic with time i.e. when you move into another quarter you add another period?
So in 2013 quarter 1 we spent £50, in quarter 2 we spent £70 with the period total then being £50 + £70 = £120. I would then compare 2014 quarter 1 against 2013 quarter 1in the pivot.
Apologies if this is simple I just couldn't seem to get it to work using the Running Total formula.
Thanks, Steve -
2 Comments
-
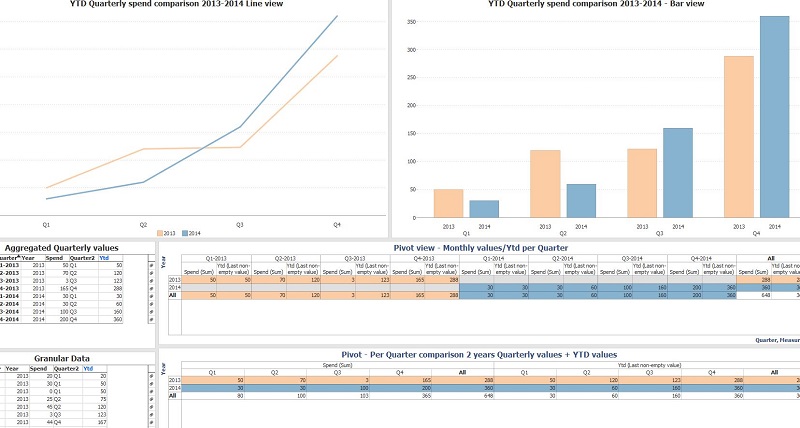
You can add a Running total formula, that runs calculation for each year
RUNNINGTOTAL([Spend], SUBSET([Year]))
When you aggregate per Quarter (or use Quarter as split option in the Bar/Line view) you should specify 'Last non-empty value' as function.
Please see attached demo. Attachments
RunningTotalYTD.iok 20K 
YTD_RunningTotal.JPG 90K
This discussion has been closed.
← All Discussions Welcome!
It looks like you're new here. If you want to get involved, click one of these buttons!
Categories
- All Discussions2,595
- General680
- Blog126
- Support1,177
- Ideas527
- Demos11
- Power tips72
- 3.0 preview2
Tagged
To send files privately to Visokio email support@visokio.com the files together with a brief description of the problem.


