
Pie View: how to display small values?
-
11 Comments
-
You can add a view next to your main pie/bar/other view and set it to look at Selected data, then you can click on 'other' values on the main chart and have the zoom into the smaller values.
Alternatively, you could create a query, that includes those values and have designated view set to look at query data. -
Hi Paola,
This is not an option. For two reasons:
1 Often there is no space for another view
2 You want to see what the percentage is without doing any selection or filtering
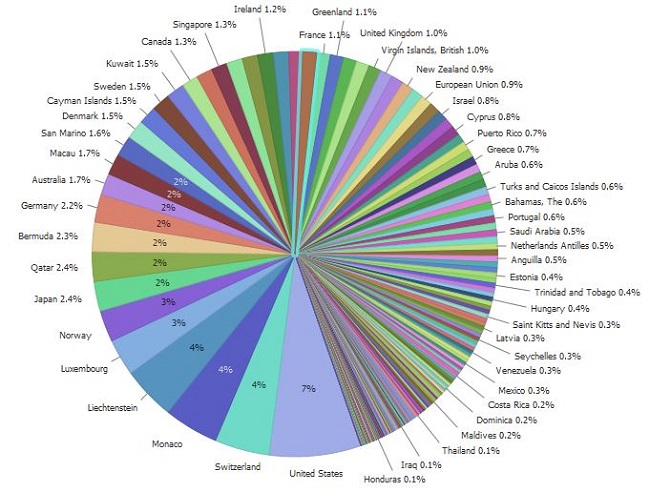
What we basically need is an option to show the values outside the circle in case the part is too small to show the value inside. -
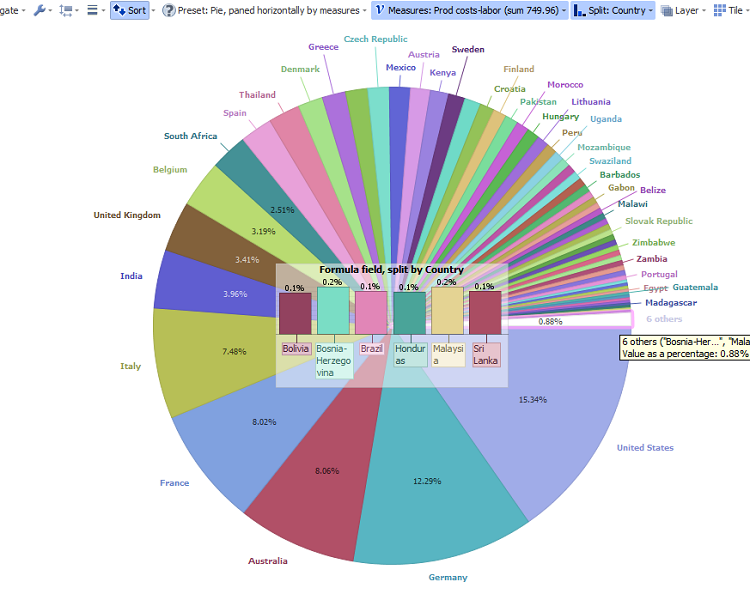
Mouse-over will show details and % values even for the smallest segments of the Pie View.
Alternative would be to use Split menu and decide how many small values to group into 'other values', then add a Hover plot (under Tools>Other) and choose Bar view and desired value field. This option will display absolute values, so if you wish to display % of the whole instead, create a new field, formated as %, with formula:SUBSET_SUM([Value], SUBSET([CategoryField]))
/
SUBSET_SUM([CategoryField])
Now set this new field as display value for the hover plot. -
Thanks Paola,
I appreciate your efforts. I do like it but often a solution like you suggest is just too much. People often want a quick impression of the chart and when they see small values, they want to know what it is without additional hover over charts or extra tables. Just a value outside the circle will do. Perhaps in between brackets after the label?
Cheers
A -
This is not a bug, but a current algorithm setting - the label will not display if there isn't enough space.
You can get around this by using several settings - the above example is an extreme case, where other views would do a better visualisation job...
In the Pie view you can choose (see Split menu) how many top values will be shown, how many (if any) 'other' values will be grouped together. You also have sort function, or option to choose angle where the first slice will start, font and margin size etc. -
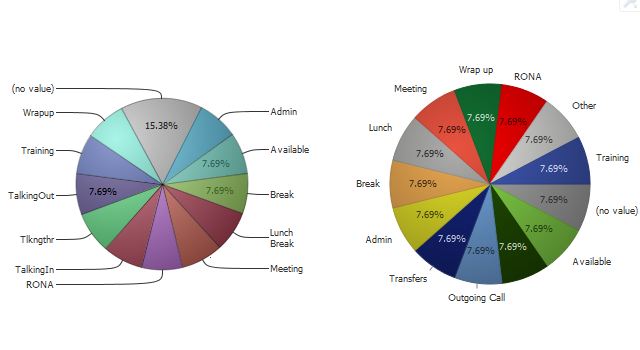
Seems like there is more to this. Here is a comparison of the same chart in 2 views, and the old one is superior in terms of label positioning. The new one misses the dark green label for no apparent reason.
 Attachments
PieView.JPG 32K -
Another option/ client question: you have a pie with many slices, but wish to isolate/colour just 1 and display just one label?
You could add a formula field that will isolate your target category (e.g.“ABC”), then create a pie view showing only split along the lines ABC/other.
IF([Keyword]="ABC",
"ABC",
"other")
Use the new field for Split and specify colouring under
Data>Manage fields>Options>Value order,colour,shapes


Welcome!
It looks like you're new here. If you want to get involved, click one of these buttons!
Categories
- All Discussions2,595
- General680
- Blog126
- Support1,177
- Ideas527
- Demos11
- Power tips72
- 3.0 preview2
Tagged
- Pie_view16
To send files privately to Visokio email support@visokio.com the files together with a brief description of the problem.