Map view: directed flows origin and destination?
-
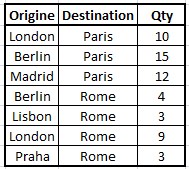
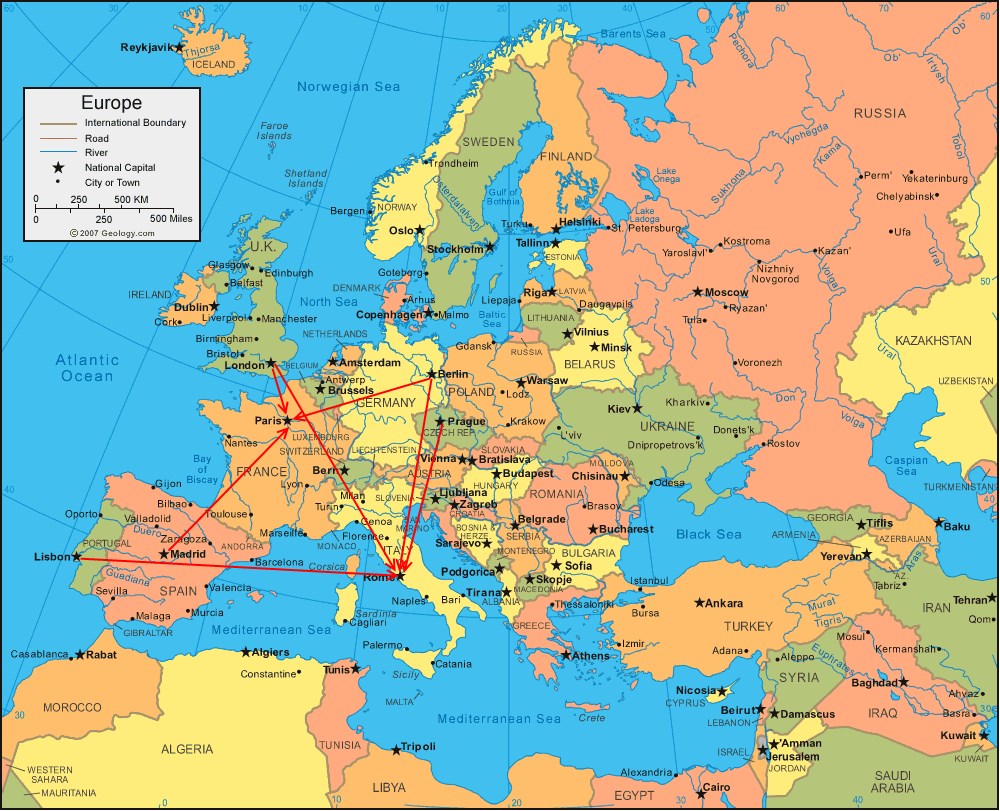
I would like to plot on a map a city of origin, a city of destination and a quantity of products shipped from one to the other. I attached a sample file (of course, I'll change the cities to their respective coordinates). I tried to use the "connect markers", I don't see how I can do that. Can you help?
PS: I added a screenshot of what I would expect it looks like.Attachments
sample.jpg 17K 
result.jpg 264K -
3 Comments
-
Hi Pascal
There are 2 methods for handling this type of data (Connect Markers & Point Overlay Spider Plots).
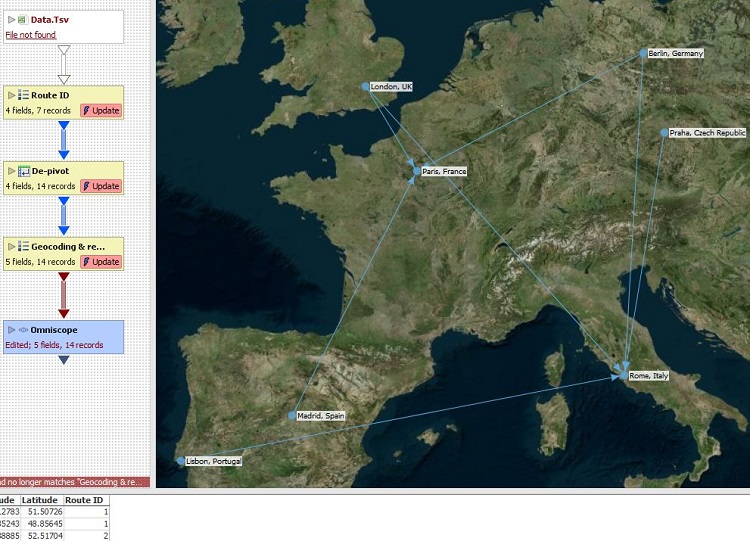
I have uploaded an example using Connect Markers. This functionality requires that the origin and destination locations use the same 2 fields. We use another field 'Route ID' to model the relationship between origin and destination. This field is then used to join the markers in Connect Markers after de-pivoting the locations.
I have outlined some of the advantages/disadvantages of the 2 approaches for your scenario:
Connect Markers
- (Advantage) Origins and destination markers/lines will all update when you reload from your data source.
- (Disadvantage) The dataset must be de-pivoted which might not be desirable for other views and the overall visualisation.
Point Overlay Spider Plots
- (Advantage) The dataset can remain in its current format
- (Disadvantage) If the destination locations change then the overlay layer must be manually reloaded and configured. This will be changed in 2.9 to automatically update the overlay layer.
I can model a spider plot version of this if you would like.
Regards
RichardAttachments
example.iok 13K -

This is a snapshot from the example file posted above.Attachments
Routing.JPG 159K
Welcome!
It looks like you're new here. If you want to get involved, click one of these buttons!
Categories
- All Discussions2,595
- General680
- Blog126
- Support1,177
- Ideas527
- Demos11
- Power tips72
- 3.0 preview2
Tagged
To send files privately to Visokio email support@visokio.com the files together with a brief description of the problem.


