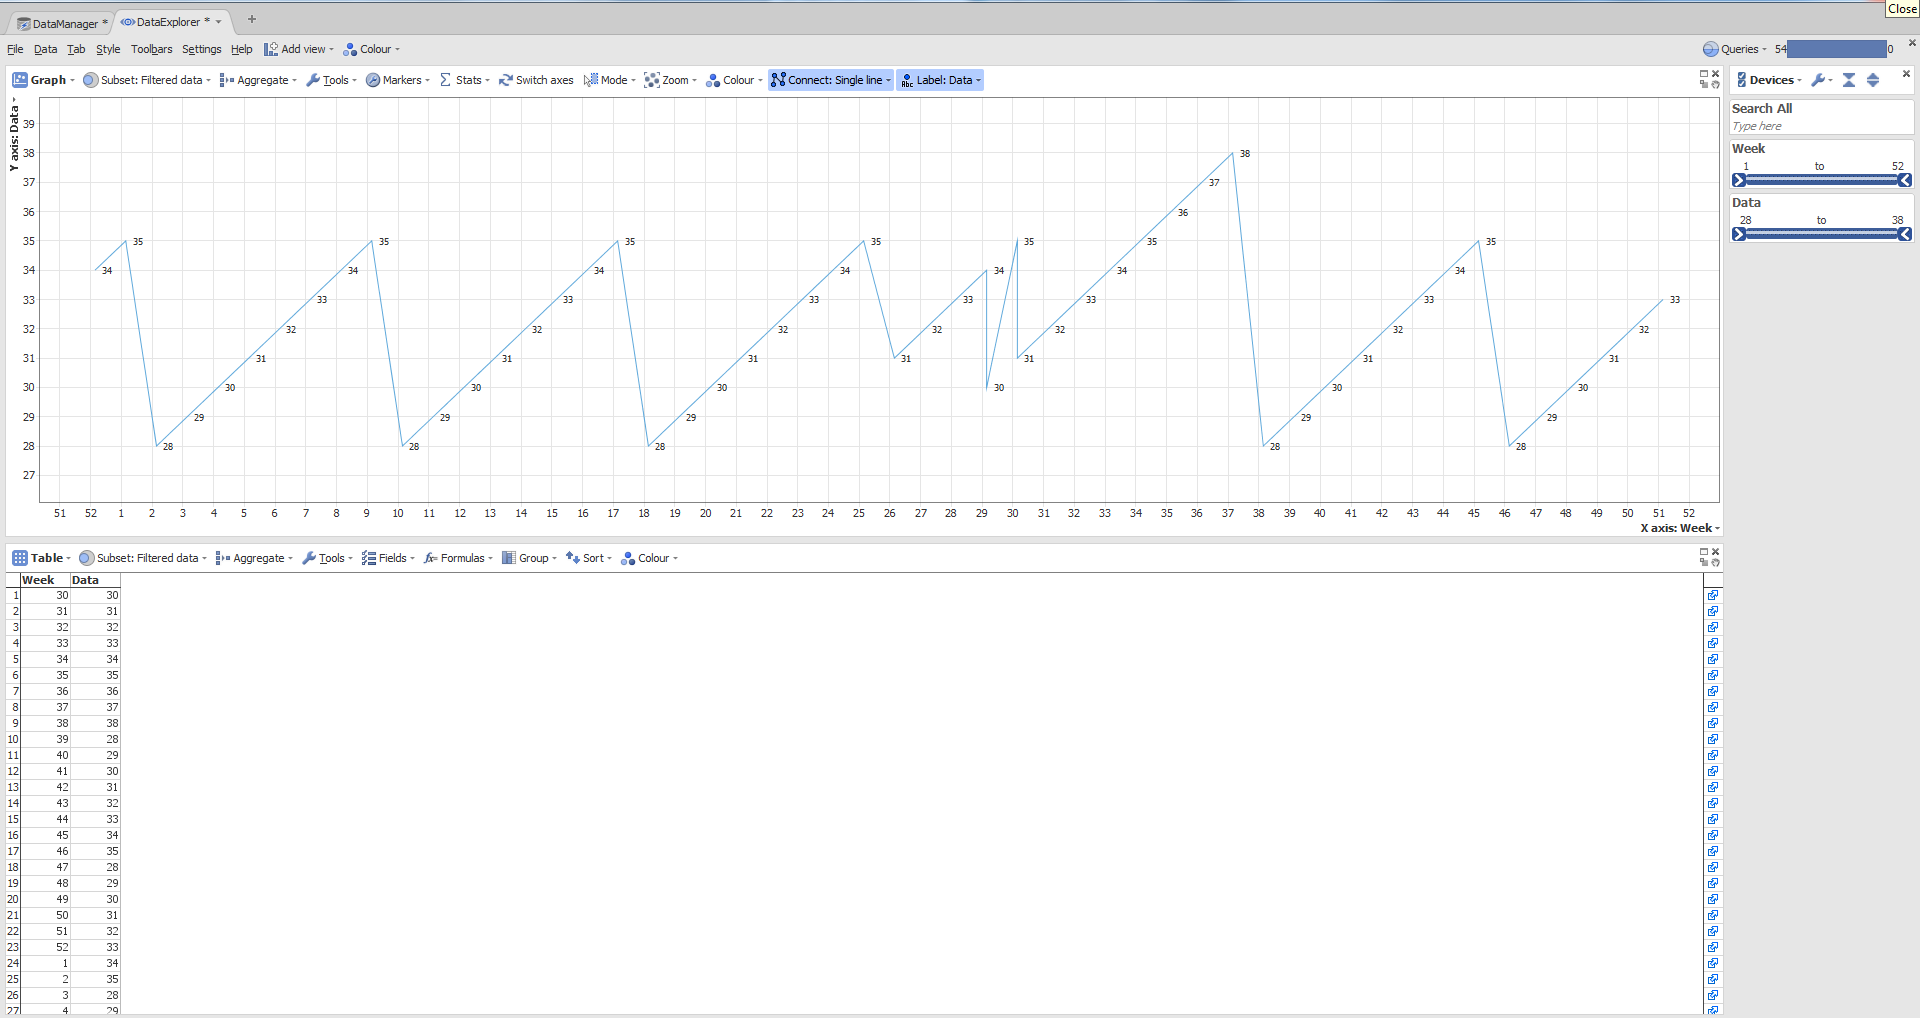
Time series - x-axis does not display the entire period
-
Hi
I'm pretty new to Omniscope, so sorry for my newbie question.
I'm working with time series, one variable (for the simplicity...) on a weekly level. Question is: My x-axis does not show the timeperiod from my datafile (xls). The Omniscope graph starts the data in week 1, instead of week 30 as in my excel file. See attached screendump. How can I fix this.
Thanks for your timeAttachments
New Picture (13).bmp 6M -
3 Comments
-
Please check how is your [Week] field formatted? Is it Date/Time (with year specified) or is it imported as Integer/Number?
Omniscope needs date information, as point in time, in order to create time series, and 'understand' that week 30, 2011 comes before week 1 in 2012.
If that information is missing, week values will be split in ascending order along the axis 1-52 ... Please send us or post here a file, so we can give you a specific answer. -
Hi
Thanks for your input. The underlying data is formated with years, and changed in Omniscope to Weeks. See attached.
Hope you can help.
Thanks for your timeAttachments
Test.iok 10K 
Stofa Input Data.xls 120K
Welcome!
It looks like you're new here. If you want to get involved, click one of these buttons!
Categories
- All Discussions2,595
- General680
- Blog126
- Support1,177
- Ideas527
- Demos11
- Power tips72
- 3.0 preview2
To send files privately to Visokio email support@visokio.com the files together with a brief description of the problem.

