
Idea: Sparklines- colouring by single row?
-
Is it possible?
-
7 Comments
-
Hi Darek,
Do you mean colouring by a single field?
This is available in the Table View under the Colour By menu.
I hope this helps.
Cheers!
IndranilIndranil Datta
Invizua Limited - www.invizua.com - Dedicated to Media, Marketing Services and Market Research Organisations
M: +44 7956 470 046 | E: indranil.datta@invizua.com | Skype: indranildatta1 | LinkedIn: www.linkedin.com/in/indranildatta | Twitter: @indranildatta
Address: Studio 6, 36-42 New Inn Yard, London EC2A 3EY -
Hi Indranil,
Colouring by single field means colouring by single column which is fine.
I would like to colour by a single row.
Thanks -
I want to colour by a row. So for example the highest value in a row (not in a column) gets the darkest/lightes colour. Please let me know if this makes sense.
Thanks,
Darek -
This is my data Table View (see attached)
Colouring by a single column doesn't make sense here because I wont to see how metrics perform over the months which can be visible by colouring by a single row.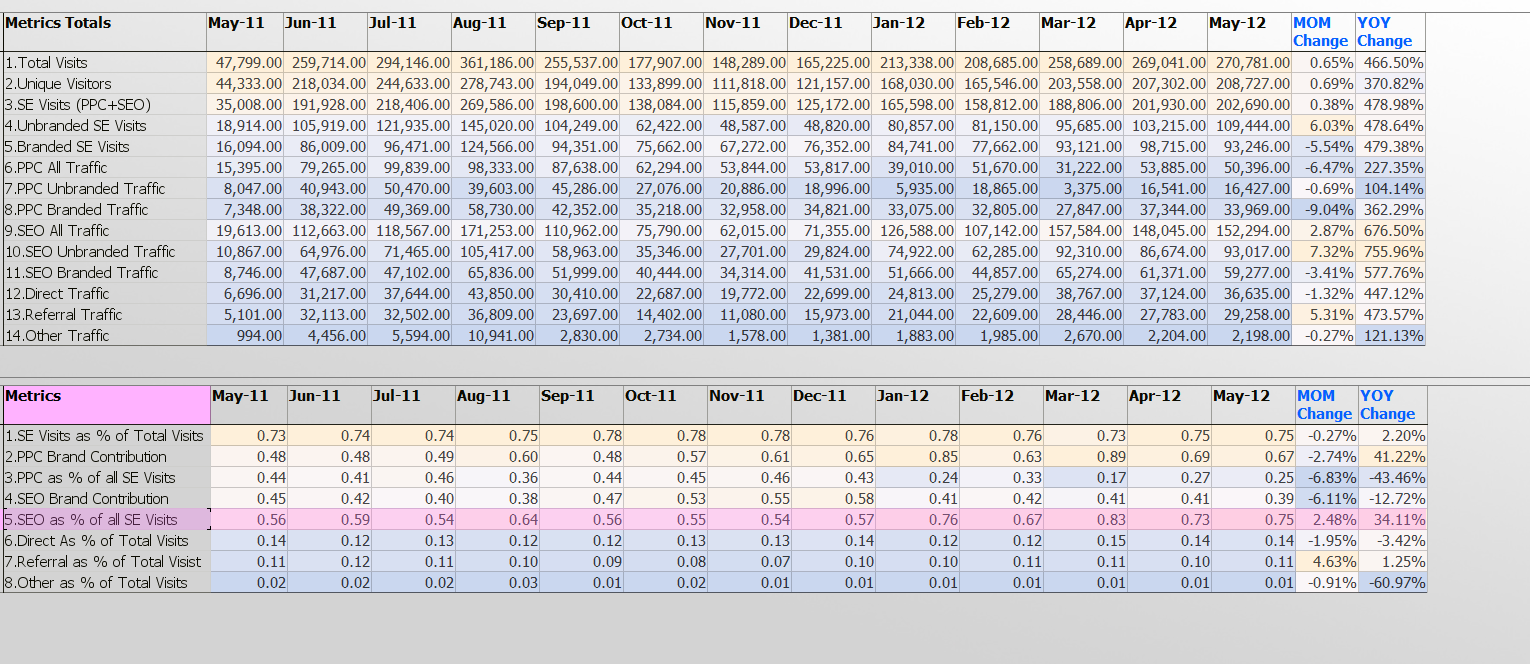 Attachments
Dashboard.PNG 251K -
Dariusz - Not in the Table View....colouring in the Table View is based on columns/fields setting, with row-by-row variation settings to aid legibility/visibility vertically, not horizontally. More powerful conditional formatting options are available in HTML table layouts in the Content View.
The tab/page layout with horizontal timeslice orientation you are working with in this file may have been specified as a data delivery format to facilitate re-use, but horizontal rows of numbers are not easy to follow visually.
What you are looking for is something like 'sparklines', small horizontal lines that show the ups and downs in the horizontal time series row values, which are much more understandable than scanning horizontally across rows of figures, coloured or not. -
See also part of this discussion here:
http://forums.visokio.com/discussion/comment/5861/#Comment_5861


Welcome!
It looks like you're new here. If you want to get involved, click one of these buttons!
Categories
- All Discussions2,595
- General680
- Blog126
- Support1,177
- Ideas527
- Demos11
- Power tips72
- 3.0 preview2
Tagged
To send files privately to Visokio email support@visokio.com the files together with a brief description of the problem.