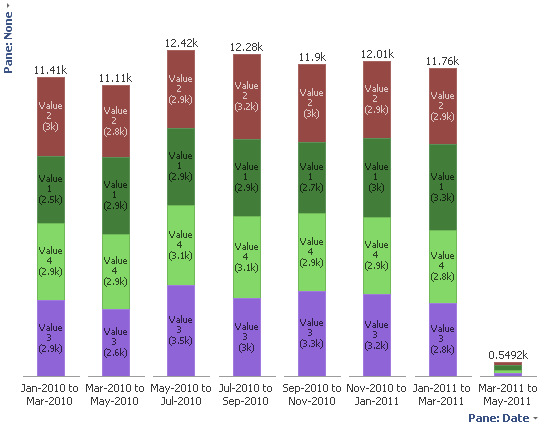
Histogram display of date x-axis on Bar Charts
-
Hello, I have bar charts which have the Date on the x-axis with the Date set to "histogram". Sometimes (eg, when there is a lack of space or there is a particular selection of the dates selected in the Devices Filter), the x-axis groups dates for each bar such as "30-Jan-2011 to 6-Feb-2011" and the bar next to it saying "6-Feb-2011 to 13-Feb-2011".
This can cause confusion as it is not clear which dates in particular the bar is referring to.
Is there any way to change the date labels so the dates do not overlap and it only displays what dates are inclusive in the bars, eg, showing "30-Jan-2011 to 5-Feb-2011" and "6-Feb-2011 to 13-Feb-2011" instead? -
6 Comments
-
Hello Steve, I have attached below an IOK showing the issue and a screenshot with the problem on the x-axis.
I am currently using the Omniscope 2.6-alpha b530 on a WinXP x32 system.Attachments
x-axis dates - Bar.png 16K 
x-axis dates.iok 24K -
After some deliberation, we have decided to change the labelling of date field "buckets" shown at the bottom of Bar view histograms to be "[inclusive] to [inclusive]".
This change has been made in 2.6 b534, available now from the daily builds section.
The new format looks like the following examples:
"1 Jan 2000 to 6 Jan 2000", "7 Jan 2000 to 13 Jan 2000", ...
"2000 to 2004", "2005 to 2009", ...
"Jan 2000 to Feb 2000", "Mar 2000 to Apr 2000", ...
However we are keeping numeric fields in the "[inclusive] to [exclusive]" style:
"0 to 5", "5 to 10"...
"0 to 1000", "1000 to 2000", ...
"0 to 500,000", "500,000 to 1,000,000"...
This is to ensure that it is clear that numbers such as 4.5, 999.5 and 499,999.5 are included in the range, and because "0 to 500,000" is more readable than "0 to 499,999".
Welcome!
It looks like you're new here. If you want to get involved, click one of these buttons!
Categories
- All Discussions2,595
- General680
- Blog126
- Support1,177
- Ideas527
- Demos11
- Power tips72
- 3.0 preview2
Tagged
To send files privately to Visokio email support@visokio.com the files together with a brief description of the problem.


