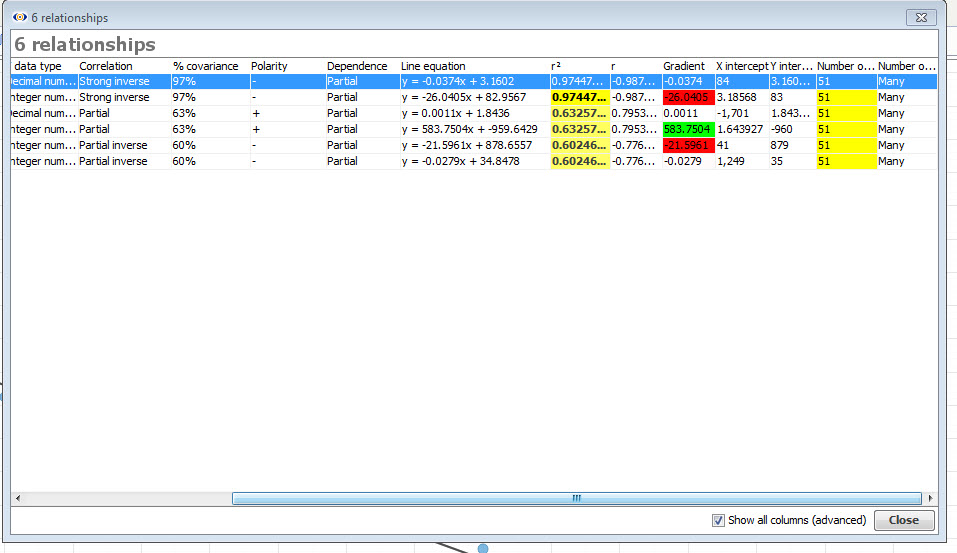
Extract best fit line data ?
-
Hi
Is it possible to extract the best fit line data from graphs to a visokio or excel file? To clarify which data I mean I have included a screenshot.
Thanks,
HannahAttachments
visokio best fit data.jpg 136K -
4 Comments
-
Hannah - If you set the Graph View axes to be the fields of correlation, Omniscope will show the real data points and an estimated line of best fit. If you want to add synthesised data points lying along the estimated line of best fit, create a Formula field with the line equation as a formula. This will generate points closer to the line of best fit as actual values in the file. You can also change the filtering selection mode in the Graph View to "best fit" select a range of points around the line of best fit and use Move/Keep filter operations to manage the data points in the IN data subset. This will affect the linear regression calculation and change/refine the line equation coefficients, which can can reflect in the formula field.
-
I only want to extract specific values i.e. the gradient and the Y intercept for a graph, I but will have a lot of graphs so manually retrieving these is quite time consuming.
Is there any way to automate this?
Thanks
Welcome!
It looks like you're new here. If you want to get involved, click one of these buttons!
Categories
- All Discussions2,595
- General680
- Blog126
- Support1,177
- Ideas527
- Demos11
- Power tips72
- 3.0 preview2
To send files privately to Visokio email support@visokio.com the files together with a brief description of the problem.


