Geographical Centre
-
Basically I have the following fields (as an example)
Ref No of orders x coordinate y coordinate
A 200 2.33 3.44
B 300 6.35 7.47
C 521 4.43 3.64
I saw in one of the product demonstrations for Visokio that Visokio can calculate a "geographical centre" for this data, so if the coordinates look like the below, (where A,B,C come from my data), Visokio can calculate X (taking into account the number of orders for each coordinate to give a weighted average central location).
A
B
X
C
Could you tell me how to do this in Visokio?
Thanks for your help. -
6 Comments
-
You need to use the Aggregate drop-down inside the map view. You need to pick a field which has the same value for all rows you want to aggregate. If you want to aggregate ALL rows, which is an unusual scenario, you will need to add a new blank field and tick that field in the Aggregate drop-down.
Then, in the aggregate drop-down also, for the lat/lon fields, choose "Mean" from the submenus.
You might also be able to achieve the same effect instead using clustering. In the Map view marker options, choose "clustered". You may be able to play with the proximity sliders to get this to do what you want. However clustering is designed to be proximity-based, and if your marker's aren't close enough, this won't work. -
Hello Steve,
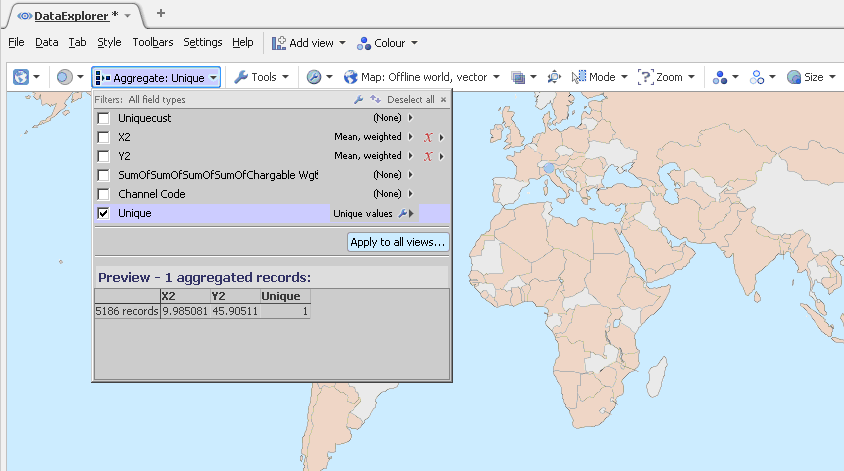
Thanks for your help. Can you just confirm if I have the settings correct?
X and y = are my co-ordinates
Unique = the same value for all rows to be aggregated
SumofsumofChargeable weight = this is the "weight" that I want to be considered in the weighted averages.
Then in the select weight field, (where the little red cross is on the picture), I have selected "sumofsumofchargeable weight" for both the x and the y co-ordinate.
Is this correct?
Thanks
AndyAttachments
visokiopic.gif 27K -
Hello Steve,
Yes, it seems to work - thanks.
The reason I asked if my set-up was correct is that I did the same kind of analysis in a different tool and the "centre of gravity location" was quite different in the two tools. In the other tool it was in Belgium area, in Visokio it was in the North of Italy. I guess the difference is due to the different algorythims used.
Thanks
Andy -
The difference could depend on whether the averaging was occurring on raw lat/lon values (as done by Omniscope) or after projecting to a mercator projection.
Or, it might be caused by null values in either X or Y skewing the result - please see if there are any, and exclude them.
When calculating an average (mean), if any values are null, they are skipped, so if you have e.g. {1, null, 3}, the mean would be (1 + 3) / 2, and not (1+3+0) / 3.
Welcome!
It looks like you're new here. If you want to get involved, click one of these buttons!
Categories
- All Discussions2,595
- General680
- Blog126
- Support1,177
- Ideas527
- Demos11
- Power tips72
- 3.0 preview2
To send files privately to Visokio email support@visokio.com the files together with a brief description of the problem.

