
Showing zero values in line graph
-
I'm preparing a graph that plots a separate line for each different record type. It's a red/amber/green distribution, so when the filters are in use, it's not unusual for the red value to be zero. In this case, the red line stops or starts abruptly - I'd like to see the plot line continue along the zero line (on the attached example, the red line would continue from the 3 mark in Jul10 to the x axis and continue to Oct 10. Is there a way of making the graph do this?
Thanks,
KevinAttachments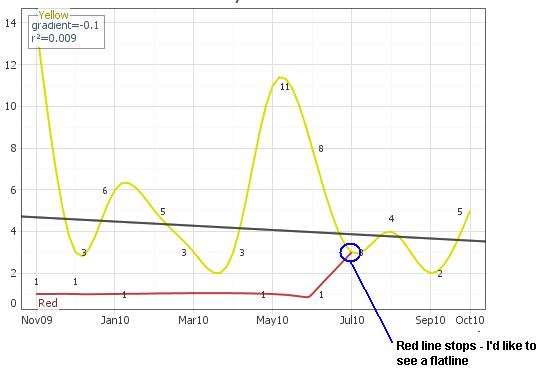
LineGraph.JPG 25K -
3 Comments
-
The graph shows zero values for the red line if there are records visible with zero as their Y value (see attached). If the records are excluded, the line will stop, as the removed records may have non-zero values, and to show a line at zero would misrepresent the data. An absent line means 'there's no data', while a zero line means 'the data is here and it's value is zero'.Attachments

Red line zero values.iok 6K -
Kevin,
The difficulty with axes in line smoothing is that if you don't want hard angles at the markers, you can't have rounded curves going through positive values and then tracking the x axis without them at least partially going below the axis. The solution is to either have less smoothing (but then have angles), or to turn off 'curves pass through points' in the Curve smoothing submenu. Have a look at the attached - all will become (smoothly) clear.
EdwardAttachmentsSmoothed lines going through X axis.iok 6K


Welcome!
It looks like you're new here. If you want to get involved, click one of these buttons!
Categories
- All Discussions2,595
- General680
- Blog126
- Support1,177
- Ideas527
- Demos11
- Power tips72
- 3.0 preview2
To send files privately to Visokio email support@visokio.com the files together with a brief description of the problem.