Pivot View: Export of Aggregated Data in Excel tables
-
Hello,
We are constantly being asked by clients if it is possible to export the view data into excel tables.
I am aware that this option exists but what the clients really want is aggregated data in a format similar to a pivot table.
When I export from the pivot table to excel I get aggregated data but cannot restrict which fields are exported.
This results in unneccessary fields, which are often meaningless as they contain "no value" as there is no unique single answer due to aggregation.
This is not very intuitive for our clients.
Ideally I would like to be able to reproduce a pivot table view in an excel table.
Can anyone help me with this problem?
Thanks for any advice.
Phillipa -
4 Comments
-
Copy/paste from a Pivot table should successfully transfer the table and headers into Excel. The number of fields is already limited to those on the X and Y axis.
If you try to export an aggregated Table view, you will go to :
Tools > Admin > Export view data
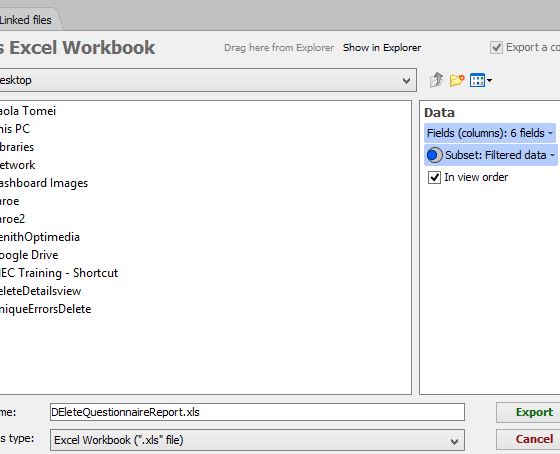
In the dialogue window there should be an option to pick which fields should be included in the extract. Attachments
ExportViewData.JPG 38K -
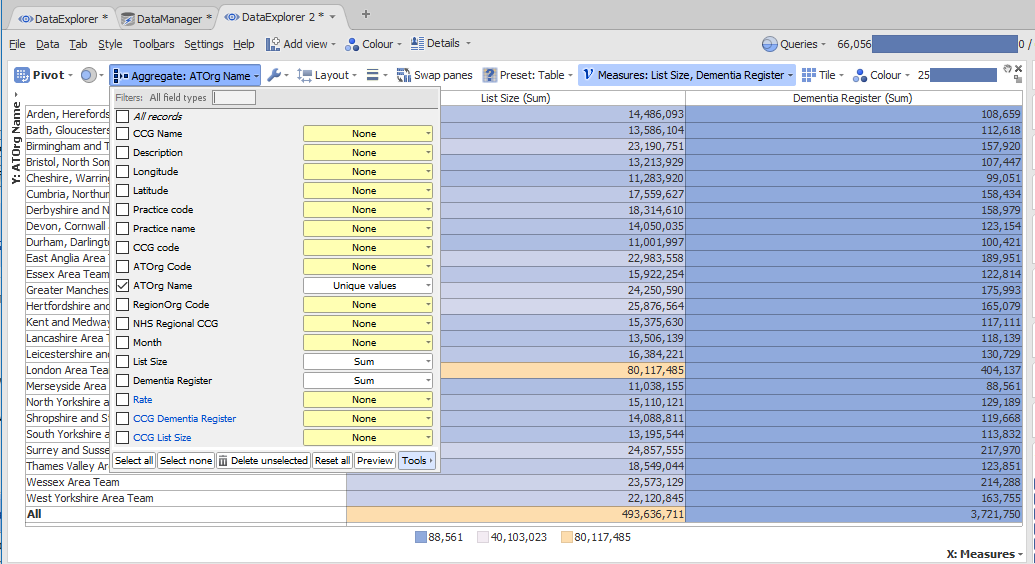
There is a behaviour you can take advantage of to do that, but you have to make sure you aggregate the data using the views aggregate options and not just the side filters.
Basically in the aggregate options, make sure all the other columns are set to "None". So start off using the "delete unselected" option first and set the aggregations for the metrics you want to keep.
Now when you use the export options only those fields you've allowed will come out of it.
This behaviour should persists for any graph view as long as you use aggregate in the same fashion.
Attachments
aggregate.png 65K
Welcome!
It looks like you're new here. If you want to get involved, click one of these buttons!
Categories
- All Discussions2,595
- General680
- Blog126
- Support1,177
- Ideas527
- Demos11
- Power tips72
- 3.0 preview2
To send files privately to Visokio email support@visokio.com the files together with a brief description of the problem.


