Application color
-
1 Comment
-
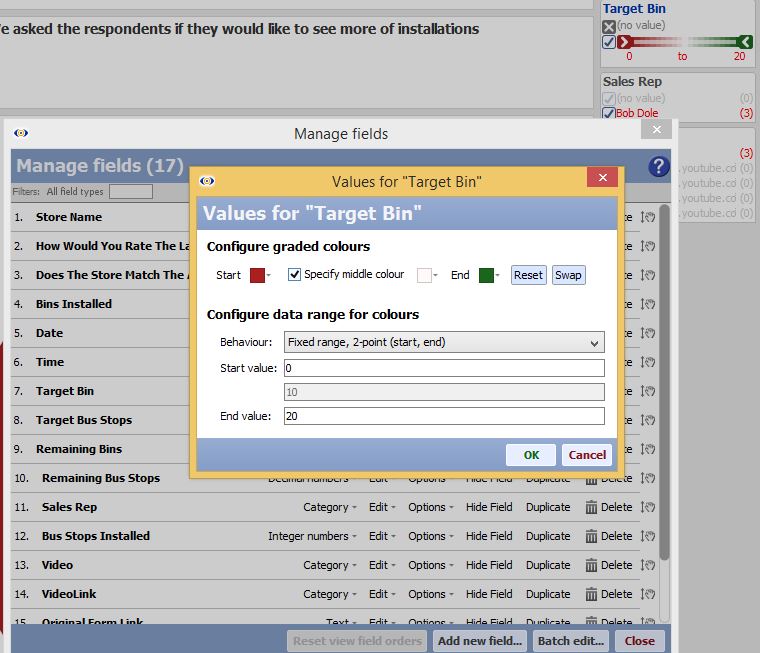
You should be able to adjust appearance of both the sidebar slider and the hover plot by using
Data>Manage fields>Options>Value colouring (for the slider)
then click on the three dots colour button next to the slider itself
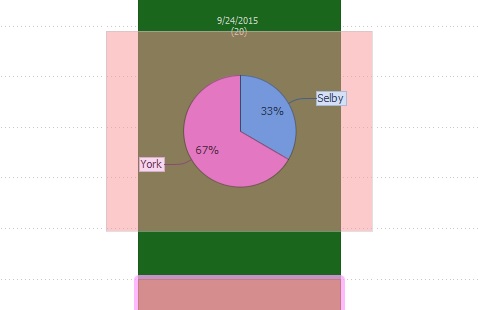
For the hover plot - enable it via the
View's Tools menu (the spanner inside the view)>Other>Hover plot
The slices of the pie (or the bars in the bar/line view) will take the colours you chose in :
Data>Manage fields>Options>Value or category colouring Attachments
SliderColour.JPG 95K 
HoverPlot.jpg 18K
Welcome!
It looks like you're new here. If you want to get involved, click one of these buttons!
Categories
- All Discussions2,595
- General680
- Blog126
- Support1,177
- Ideas527
- Demos11
- Power tips72
- 3.0 preview2
Tagged
To send files privately to Visokio email support@visokio.com the files together with a brief description of the problem.


