Bar/line View: Custom date range with no value endpoint?
-
Hi,
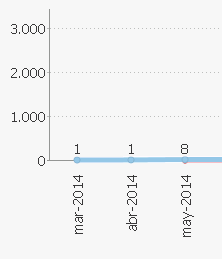
I'm trying to show a plot from data starting in January, but I don't find the way to set a custom plot range, since it coincides that in that specific month we don't have any data point value.
Any way to make that plot to start from Jan-2014?
Is there a way to work that through?
Thanks,Attachments
example.PNG 2K -
3 Comments
-
You could insert a date 'place-holder', so record with date 1/1/2014, and leave the value field empty.
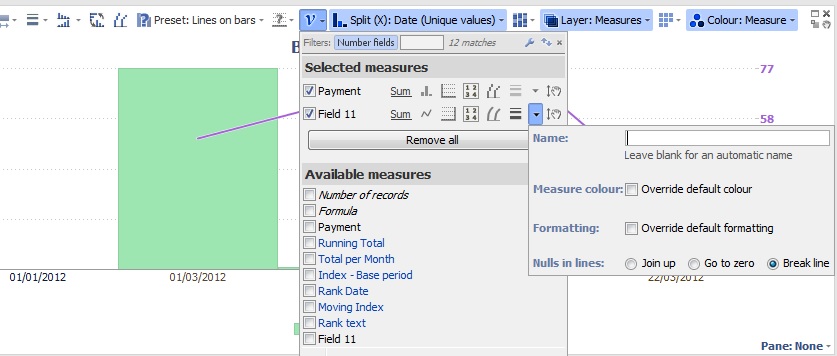
Under the Measures menu in the Bar/line view, click on the sub-menu for the specific line measure and choose the option 'Break line', so January date will be visible on the X axis, while the null value measure will not be connected with other values. Attachments
BarLineBreak.jpg 71K -
The measurement is the number of records... Is there any way I can put a null record that is not counted?
Welcome!
It looks like you're new here. If you want to get involved, click one of these buttons!
Categories
- All Discussions2,595
- General680
- Blog126
- Support1,177
- Ideas527
- Demos11
- Power tips72
- 3.0 preview2
Tagged
- Bar/Line_View102
- axes4
- start_date3
To send files privately to Visokio email support@visokio.com the files together with a brief description of the problem.


