Graph View: Tutorial Video
-
Hi,
I work with DataManager and with Omniscope Dashboard like a beginner.
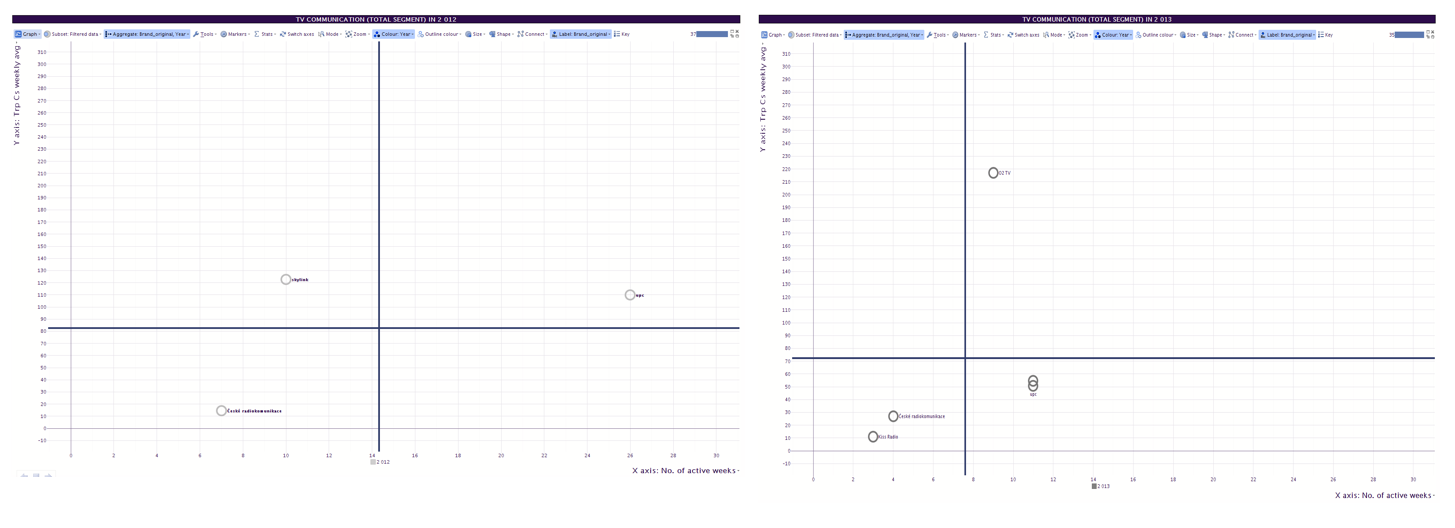
I need to help with these visualization something like on my example.
I need to show cross line for active weeks (TV campaign) and number TV GRPs.
Or in generally I need to show cross line from specific datas.
Can you help me, how can I do this? Thank you for your help.Attachments
Graph line.png 104K -
1 Comment
-
We have a page with video tutorials, which are really helpful if you're a beginner. Every video is about 5min long, so you can go through them at your own pace.
http://www.visokio.com/video-tutorials
Here is the one about the Graph view:
http://tc.visokio.com/videos/?name=GraphView&title=Graph&lang=gb
If it doesn't help with your question, please post a sample dataset.
Welcome!
It looks like you're new here. If you want to get involved, click one of these buttons!
Categories
- All Discussions2,595
- General680
- Blog126
- Support1,177
- Ideas527
- Demos11
- Power tips72
- 3.0 preview2
Tagged
To send files privately to Visokio email support@visokio.com the files together with a brief description of the problem.

