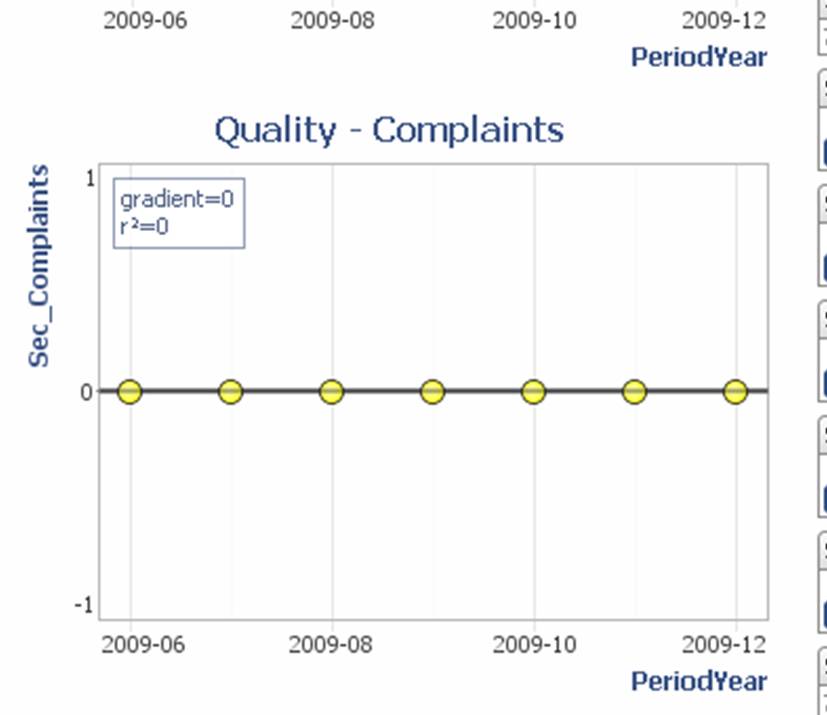
Amend Y axis range manually
-
Is it possible for me to set the Y axis range in Graph View ? I have a few graphs where the Y axis displays automatically and includes -1 values which are imossible and confusing. In the attached example, all data is 0 and the Y axis goes from -1 to 1. -1 is impossible.Attachments

Y axis.jpg 30K
Welcome!
It looks like you're new here. If you want to get involved, click one of these buttons!
Categories
- All Discussions2,595
- General680
- Blog126
- Support1,177
- Ideas527
- Demos11
- Power tips72
- 3.0 preview2
To send files privately to Visokio email support@visokio.com the files together with a brief description of the problem.

