
GIS: Map View - Spider plots
-
Omniscope's Map View supports creating spider plots between points in your currently loaded dataset (AKA "current dataset") and points in an overlay dataset.
In this example we are going to create a spider plot linking the company's distribution centres to each of the customers awaiting a delivery.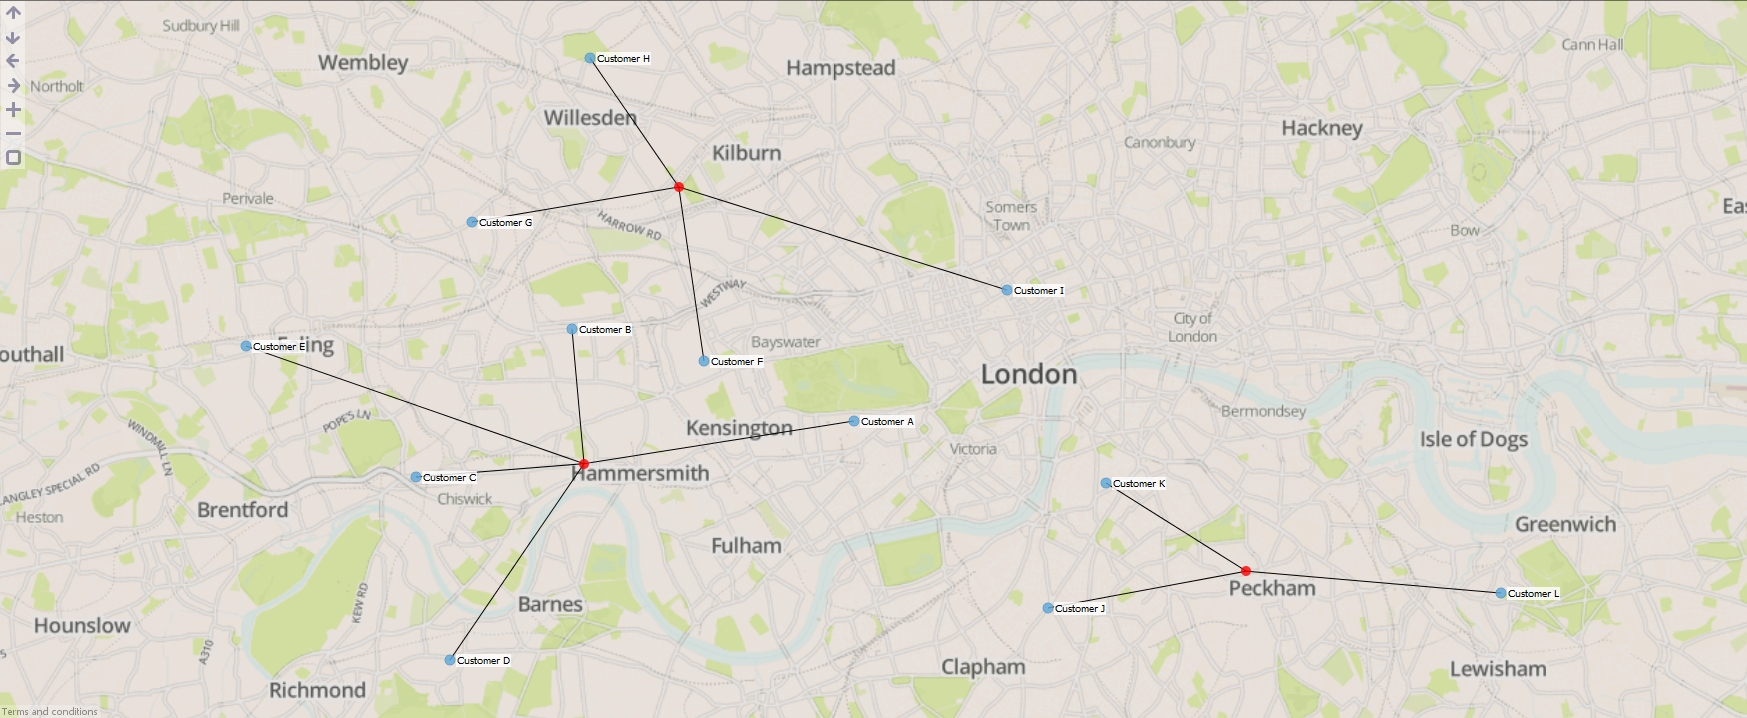
ATTACHMENTS- Customer deliveries.csv - A CSV file containing the location's of customers and the name of the distribution centre where the delivery will originate.
- Distribution centres.csv - A CSV file containing the location's of a company's distribution centre..
INSTRUCTIONS- Open "Customer deliveries.csv" in Omniscope.
- Change the Bar/line View to a Map View, which will display the location of each customer.
- Now we need to add the second CSV file as an additional layer in the Map View. Drag "Distribution centres.csv" onto the Map View and select 'Open as a map overlay'.
- The next dialog allows you to customise how the data will be imported. This contains the same options you would see in a DataManager block for the same file type. Click "OK".
- Now we can configure how the Map View should interpret the distribution centre data. We need to tell Omniscope what type of data the file contains, e.g. point, line or area, and also which fields contain latitude/longitude values etc. See the ADVANCED section at the end of this post for more information. For now just configure the settings to match the screenshot shown below and click "OK".

- The distribution centres are now displayed alongside the curent dataset's customer locations but they all look the same, so we need to customise the view. In the Map View toolbar, go to the "Label" menu and select "Customer" to add some labels.
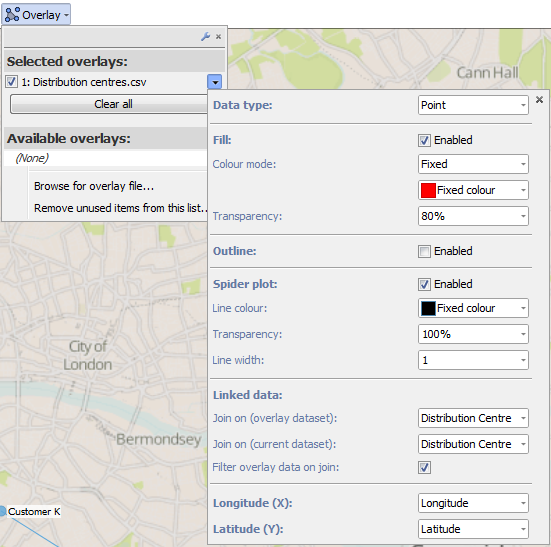
- Now we need to change the colour of the distribution centres. In the Map View toolbar, go to the "Overlay" menu and select the downward pointing arrow next to "Distribution centres.csv". This will display a panel containing advanced options for your overlay layer.

- Click on "Fixed colour" and choose another colour to update the distribution centres.
- Click on "Spider plot" to begin enabling spider plots. You'll notice there is a message 'No "Linked data" field selected for the current dataset.'. In order for Omniscope to link these two datasets together we need a common field with values found in both datasets. Our sample CSV files both contain a "Distribution Centre" field with common values so select that next to the "Join on (current dataset)" control. We now have a basic spider plot connecting each distribution centre to it's respective customers.
- You might have noticed that some distribution centres have disappeared from the map. By default after you have created this link between 2 datasets, Omniscope will not display any overlay points which do not have related data in your currently loaded dataset. To disable this behaviour uncheck "Filter overlay data on join".
ADVANCED
In the Map View overlay functionality you will come across terms like "Overlay ID", "Overlay identifier", "Data type". Below are explanations for each of these terms and how they are used by Omnsicope. If you are using KML or Shapefile sources then most of these fields will be configured automatically.
Data types- Point - A dataset containing pairs of latitude/longitude coordinates, e.g. a shop location.
- Line - A dataset containing connected, and unfilled/unclosed, chains of points, e.g. a hurricane path or road.
- Area - A dataset containing connected, and filled/closed, chains of points, e.g. a post code area or country border.
Fields- Overlay identifier - Field containing unique identifiers for each point, line or area in the input dataset, e.g. a field containing country names or postal area codes.
- Overlay sub-path identifier - This is used internally within Omniscope to identify nested geometries within each shape. For example a shape for the United Kingdom could not be drawn with one continuous line. We use this field to breakdown the records into numerous islands which make up the country.
- Longitude - Field containing WGS84 longitude values.
- Latitude - Field containing WGS84 latitude values.
Attachments
Distribution centres.csv 222B Customer deliveries.csv 615B 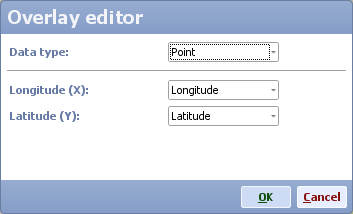
Overlay editor dialog.png 7K 
Map View.jpg 2M 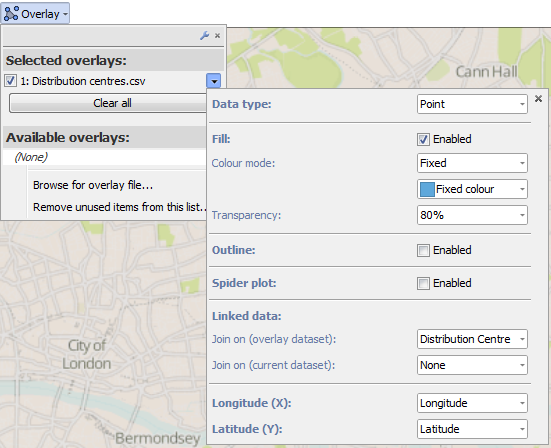
Overlay menu - new.png 110K 
Overlay menu - configured.png 155K

Welcome!
It looks like you're new here. If you want to get involved, click one of these buttons!
Categories
- All Discussions2,595
- General680
- Blog126
- Support1,177
- Ideas527
- Demos11
- Power tips72
- 3.0 preview2
Tagged
To send files privately to Visokio email support@visokio.com the files together with a brief description of the problem.