
GIS: iGeolise isochrone/time maps operation
-
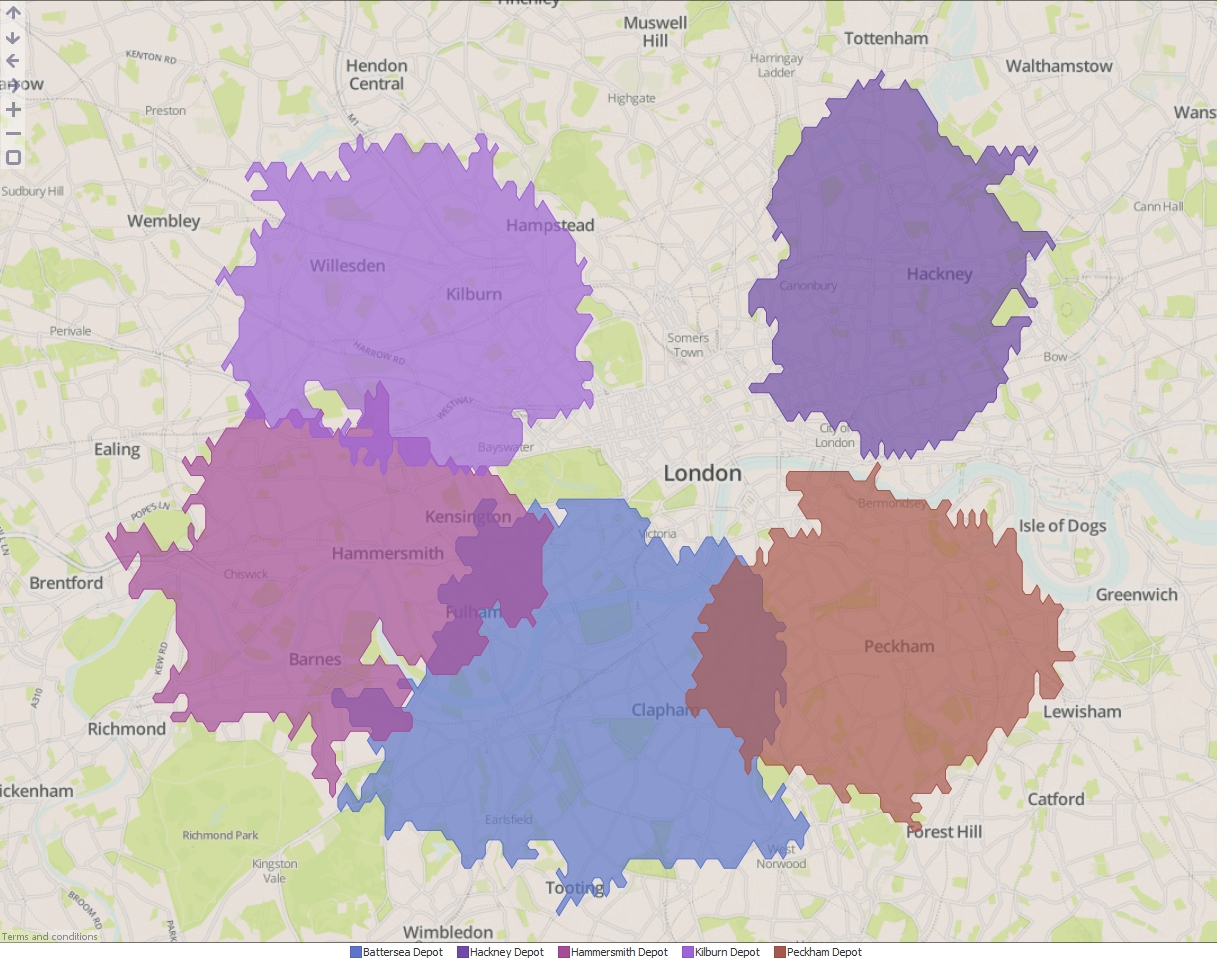
Omniscope's DataManager supports generating isochrone/time maps around an origin point using a service provided by iGeolise. For example, this could be used to generate a customer delivery area of 30 minutes travel time (by car/van) from a retailer's distribution centre.
The following example assumes that you already have an iGeolise Travel Time account. You can sign up for an account by clicking on "iGeolise account help" in the DataManager block noted below and following the link.
ATTACHMENTS- Distribution centres.csv - A CSV file containing the locations of a company's distribution centres across London.
INSTRUCTIONS- Create a new file in Omniscope and go to DataManager.
- Drag "Distribution centres.csv" onto the DataManager workspace.
- Create a new "iGeolise Travel Time" operation and connect it to your workflow. This block will use the point data from the CSV and generate boundaries around each point to show how far can be travelled in a given time period.
- Enter your iGeolise Travel Time application ID and key.
- Choose the "Travel Time Maps" service.
- Change the "Transport type" to "Driving" so the service will calculate results based upon how far the company's delivery vans can travel by road.
- Enter a maximum journey duration, e.g. 10 minutes.
- You can change the "Result type" to show a separate shape for each distribution centre, merge all shapes into one or even intersect all the shapes to identify the cross-over areas.
- Execute the block, load the data into Omniscope and then drag a Map View into Omniscope to see the Time Maps.

ADVANCED
The "Travel Time Maps" service contains advanced options for configuring which fields contain contain the latitude/longitude values and the field for uniquely identifying individual points in the input dataset. If you are using KML or Shapefile sources then these fields will be configured automatically. Below are explanations for each option:- Point identifier - Field containing unique identifiers for each point in the input dataset. In our example this would be the names of the distribution centres.
- Longitude - Field containing WGS84 longitude values.
- Latitude - Field containing WGS84 latitude values.
Attachments
Distribution centres.csv 222B 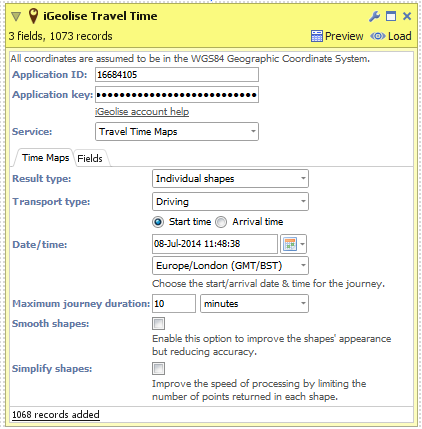
DataManager Block.png 22K 
Map View.jpg 1M

Welcome!
It looks like you're new here. If you want to get involved, click one of these buttons!
Categories
- All Discussions2,595
- General680
- Blog126
- Support1,177
- Ideas527
- Demos11
- Power tips72
- 3.0 preview2
Tagged
- mapping30
- location_analytics15
- gis4
- iGeolise3
To send files privately to Visokio email support@visokio.com the files together with a brief description of the problem.