
Bar/Line view: "Custom axis range" changing?
-
Hi All,
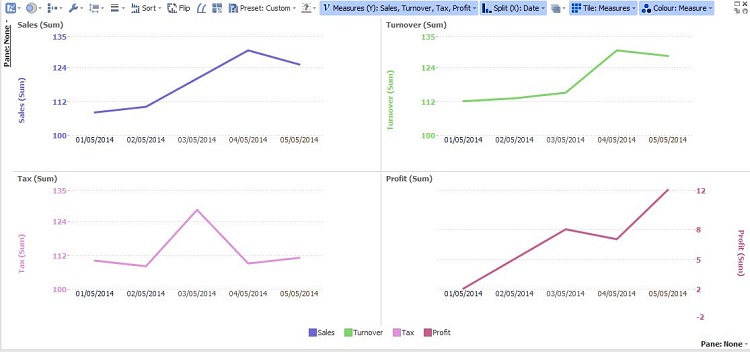
I have set up a Bar-Line view that is layered on 4 measures. 3 measures have values between 108 and 130. So that left axis is showing a range that is similar to the range of values! This works great.
However, I have a 4th measures with values from 1 to 12. I set up this value on a right axis. Now the left axis expands the range from 108-130 to 0-130. This results in (almost) flat lines of the 3 measures that are measured on this left axis.
I think this is a bug, because there is no lower value in the dataset that is plotted in the left axis, so the range should not change? I am available for a screen share today or tomorrow. -
9 Comments
-
Hi Paola,
Paning or tiling is not a satisfying solution. We use omniscope to layer these measures, in order to compare the path and relationship. In a paned of tiled view, this is not achieved.
Of course we can wait for 2.9 but this should work in Omniscope, also in 2.8. We understand that making drastic changes in 2.8 is something you want to prevent, but bugfixing is always been done in the past.
Hope you can help us and understand our position in this matter.
Thanks! -
Alex -
Although there is an option "Extend axes to show zero", if unticked, the common origin line is still in effect, it's just out-of-view.
Unfortunately, this is a deeply rooted architectural limitation in the 2.8 interface that would be very complex and risky to address. It's not really a bug. It's missing functionality, granted....but not really a bug.
The only workaround in version 2.8 is to use separate views, I believe.
We are addressing this issue in the version 2.9 interface, which uses different underlying technology and does not pose the exact same problems we encountered in version 2.8.
-
Hi Thomas,
Thanks for your reaction.
We understand your point of view completely. However, I have the feeling that I did not manage to explain the problem I am encountering. Can I show this to you, or someone else at Visokio in a short screen share.
In adjusting the range manually for the left and right axis, Omniscope checks if all underlying measures have no values below or above this range. For both axis (when not combined) this works great. But when I am combining these two axis in one view the problem occurs.
The range of the left axis (set to 100-130) is ignored, because of lower values that are projected on the right axis.
When can we do a screen share?


Welcome!
It looks like you're new here. If you want to get involved, click one of these buttons!
Categories
- All Discussions2,595
- General680
- Blog126
- Support1,177
- Ideas527
- Demos11
- Power tips72
- 3.0 preview2
Tagged
To send files privately to Visokio email support@visokio.com the files together with a brief description of the problem.