Scripting: Incorporating Google Charts Gallery?
-
https://developers.google.com/chart/interactive/docs/gallery
Would it be possible to get these graphs into Omniscope's Content view? I'm mainly interested in the Timeline and the Candlestick charts which Omniscope views do not currently provide.
I've been able to get the code examples to work but I don't know how to write the JavaScript to actually get the graphs to use the data within Omniscope files.
Clarification:
The code example here has a section which define var data and the array of data, how do I write it so that var data becomes a reference to columns of data in the Omniscope file?
var data = google.visualization.arrayToDataTable([
['Mon', 20, 28, 38, 45],
['Tue', 31, 38, 55, 66],
['Wed', 50, 55, 77, 80],
['Thu', 77, 77, 66, 50],
['Fri', 68, 66, 22, 15]
// Treat first row as data as well.
], true);
https://developers.google.com/chart/interactive/docs/galleryAttachments
Google Charts.iok 10K -
1 Comment
-
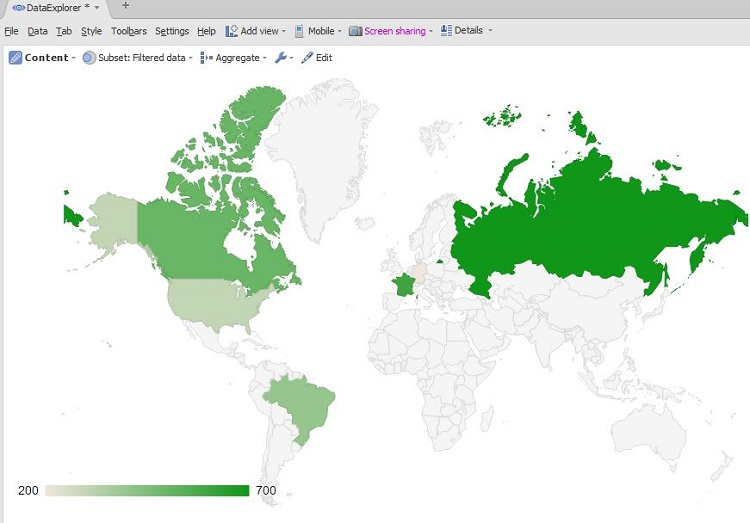
The script found on this page
https://google-developers.appspot.com/chart/interactive/docs/gallery/geochart#Regions
will work inside the Content view when you tick Content view tools>Native browser option and copy/paste the script, replacing everything inside.
You should then be able to connect created map with the data in Omniscope, using the API as described here:
http://forums.visokio.com/discussion/1731/content-view-native-browser-javascript-api-2.8-
Advanced users with JavaScript development skills can effectively build a custom view in Javascript, which runs in your system browser, embedded inside the Omniscope Content View, with the page source editable in the Content View as usual Attachments
GoogleScriptContentView.JPG 79K
Welcome!
It looks like you're new here. If you want to get involved, click one of these buttons!
Categories
- All Discussions2,595
- General680
- Blog126
- Support1,177
- Ideas527
- Demos11
- Power tips72
- 3.0 preview2
Tagged
To send files privately to Visokio email support@visokio.com the files together with a brief description of the problem.


