
Analysis: Dynamic Field Normalization (using a Variable?)
-
Novice ?:
I have a stock index data set that consists of the following attributes: portfolio, date, index. all told, about 18 years of daily index values for 20 portfolios. In Omniscope, I wanna choose a number of portfolios and a date range, then compare portfolio performance through the indexes. how can I dynamically create a normalized index variable that starts at one for each portfolio and date range selected? e.g. for each portfolio and date range, I wanna divide the index vector by the first value?
Thanks. -
9 Comments
-
Hi Steve, would you be able to send us a data sample so we can create formulas and test them on the dataset? You can hide any sensitive info by using the Scramble operation in the DataManager space, also the Random Sample block to trim the number of records. Thanks
-
Here you go -- everything. Thanks!Attachments

russellstack.csv 5M -
Please save both files in the same folder on your machine.
The variable used in the file is the Base Date, slider used to pick a single value to be used for index calculation, rather than a date range. 2-sided slider can be applied to [PDate] field, to format the time series. Formula used for normalised index calculation:[Idxwodiv]*100
/
SUBSET_FIRST([Idxwodiv], SUBSET2([Pdate], [Portfolio], [Base Date],[Portfolio]))
It will pick up the first value in the field [Idxwodiv], and then for each given [Portfolio] value, where the date is equal to the chosen Base Date variable value.
Layering choice is [Portfolio], so you can pick any number of these by using the side bar filter to compare on the same scale.
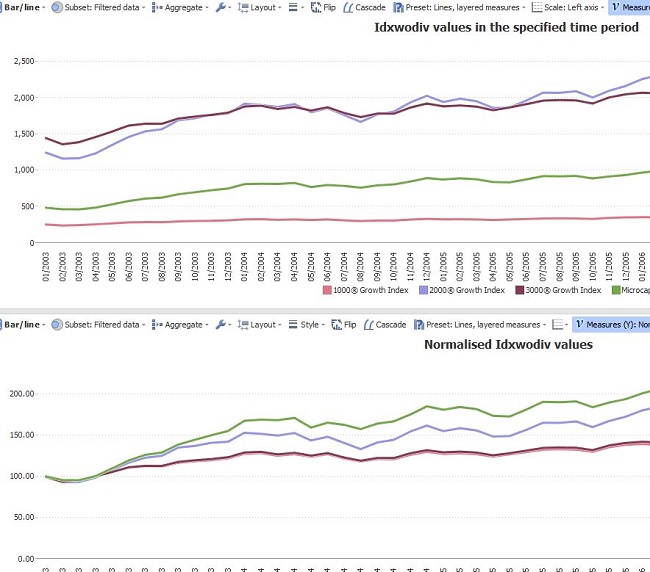
The top Bar/Line view shown below has [Idxwodiv] measure choice, with Mean function, so calculates the average for each period. Similarly, the second Bar/Line view displays normalised values as measure, with mean function. It will touch 100 value in the chosen base period. You can move the date slider to start from the Base Date and have 100 as the period 1 value....Hope this answers your question!
AttachmentsRusselTrading.iok 2M russellstack.csv 5M -
I think I implemented what you suggested. If I got it right, I have to maneuver both date sliders to it work. Feels pretty awkward.
-
The two-sided date slider defines start and end date of the time series. Base period is a variable that can take only one value, therefore two-sided filter would not work. This scenario gives you flexibility to experiment and select a base period at start, end, or somewhere in the middle of your target period...
By all means, please let us know if there is a more efficient way to do it and we'll look into it. -
Ok, a next challenge is providing scatter plots of the daily percent changes in portfolio index values, eg, a graph of pctch Russell 1000 by pctch Russell 2000 Value. I assume I need to create a new file transforming the stacked row of index values to separate percent change columns.
-
Firstly dates for available data for each Portfolio should be placed in order, using the Rank function:
RANK([Pdate], [Pdate], true, false, SUBSET([Portfolio]))
This formula can be used in the next Subset formula to work out the 'vertical difference' between subsequent index values for each Portfolio (it will not break if data is missing for some dates, e.g. weekends). For the first date in the series the difference field will be left blank.IF([RankDate]=1, null,
(SUBSET_MEAN([Normalised Idxwodiv %], Subset2([Portfolio],[RankDate]))
-
SUBSET_MEAN([Normalised Idxwodiv %], Subset2([Portfolio],[RankDate],[Portfolio],([RankDate]-1))))
)AttachmentsRusselTrading.iok 3M 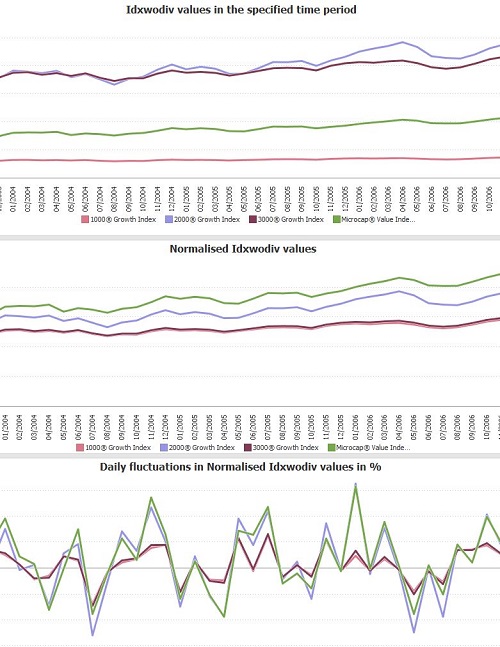
Russel.JPG 107K -
Please see the two tabs created in the report, for two index values.
 Attachments
Russel.JPG 107K


Welcome!
It looks like you're new here. If you want to get involved, click one of these buttons!
Categories
- All Discussions2,595
- General680
- Blog126
- Support1,177
- Ideas527
- Demos11
- Power tips72
- 3.0 preview2
Tagged
To send files privately to Visokio email support@visokio.com the files together with a brief description of the problem.