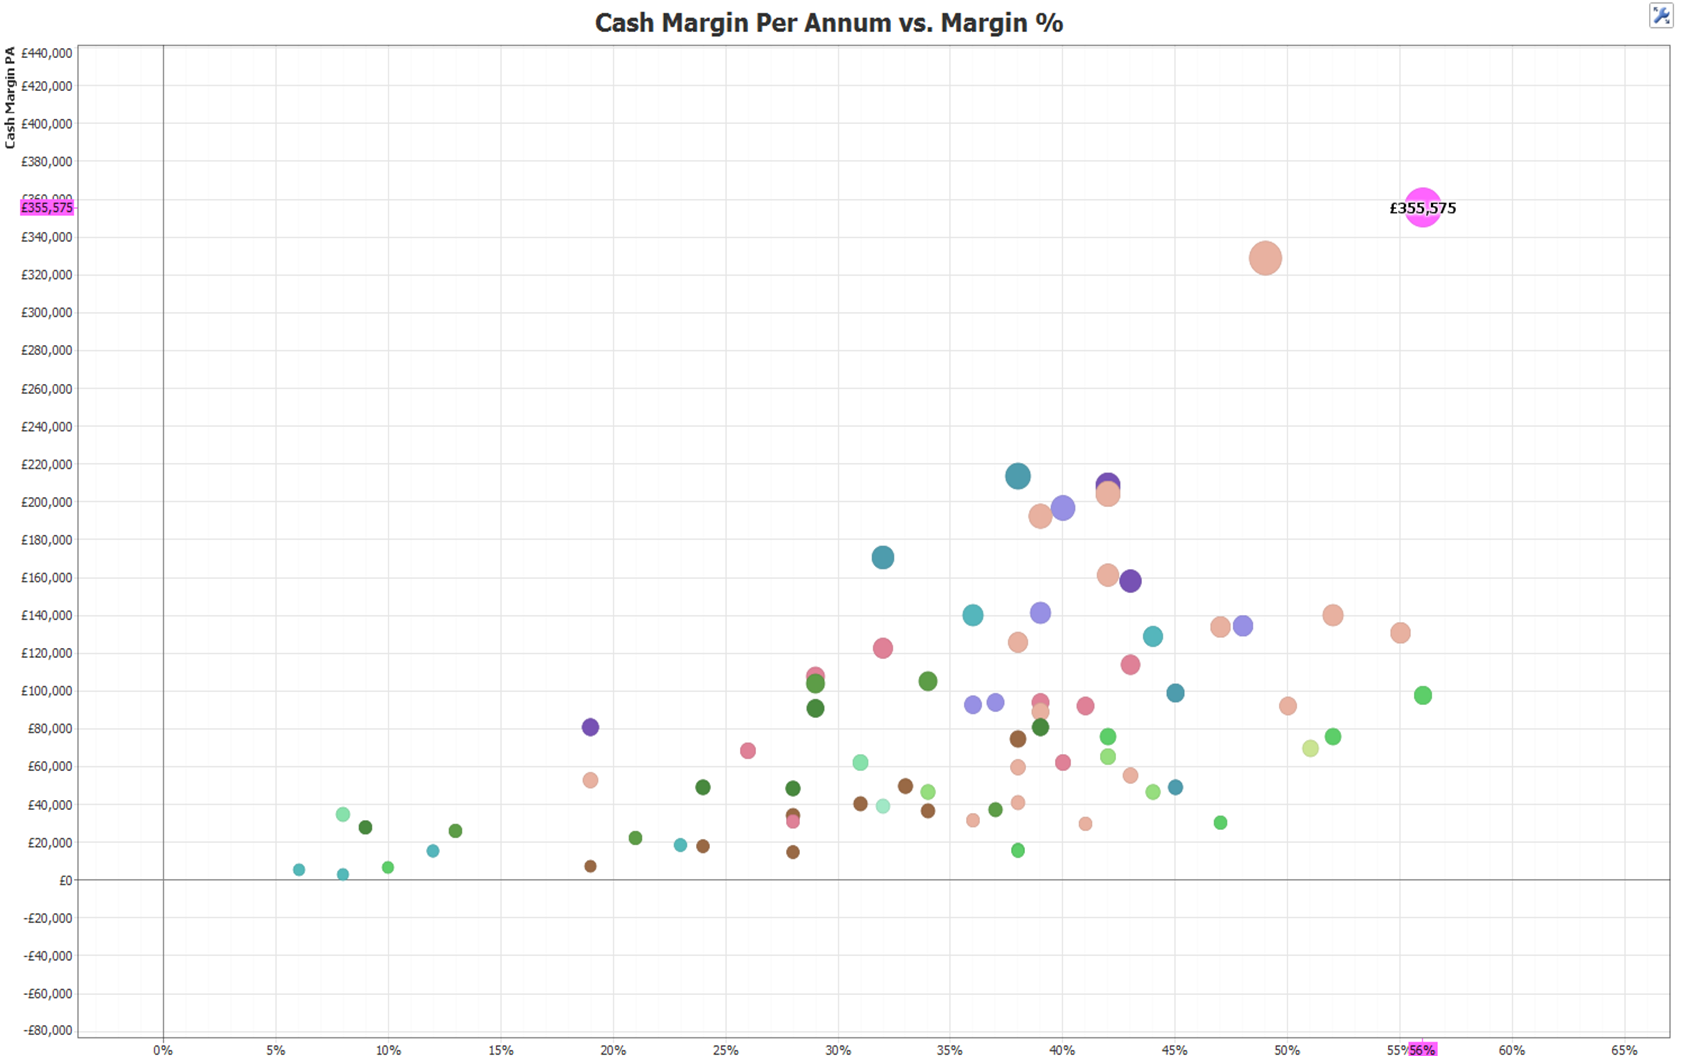
Idea: Graph View-Mouse Hover Value Display Options?
-
Hi...I was wondering if it is possible to change the settings of the mouse hover (see attached image) on a graph.
Instead of showing my £355k - which I can see on the y-axis myself - is it possible to set it as another field? i.e. I want to show the Directors our most profitable products and those which contribute most to the business and talk through which these are, without having to click and go into every single one.
Being able to quickly hover and see it is "product X" would help massively in this top line overview
Thanks in advance, MichaelAttachments
Mouse Hover Query.png 199K -
1 Comment
-
Michael - Currently you can persistently display the Size-by value inside markers, and any value alongside using Label:, but mouse hover options are either hover plots (which are additional visualisations) or selection modes for filtering, rather than displaying values on hover.
I have re-classified this as an Idea for further comment and development
Welcome!
It looks like you're new here. If you want to get involved, click one of these buttons!
Categories
- All Discussions2,595
- General680
- Blog126
- Support1,177
- Ideas527
- Demos11
- Power tips72
- 3.0 preview2
Tagged
- labelling40
- Graph_view25
- mode2
- hover2
To send files privately to Visokio email support@visokio.com the files together with a brief description of the problem.

