
Radar View (Omniscope 2.8+)
-
The newly-introduced Radar View allows you to create radar plots.
The radar plot, also referred to as 'spider plot' or 'star plot', can be very effective in visualisation of multivariate data.
Radar View has 2 main ways to present your data:- Standard radial layout
Classic way of plotting values of each category along a separate axis/spoke laying them out in a radial style.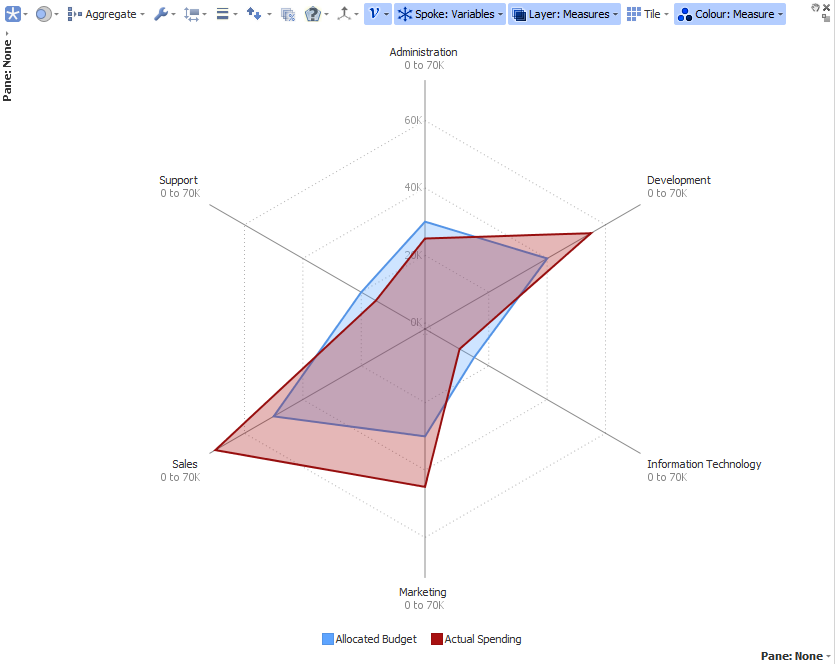
- Parallel coordinates
It lays out parallel axes and plots the data elements across several dimensions.
Each dimension corresponds to one vertical axis, and the data elements are displayed as series of connected points along the axes.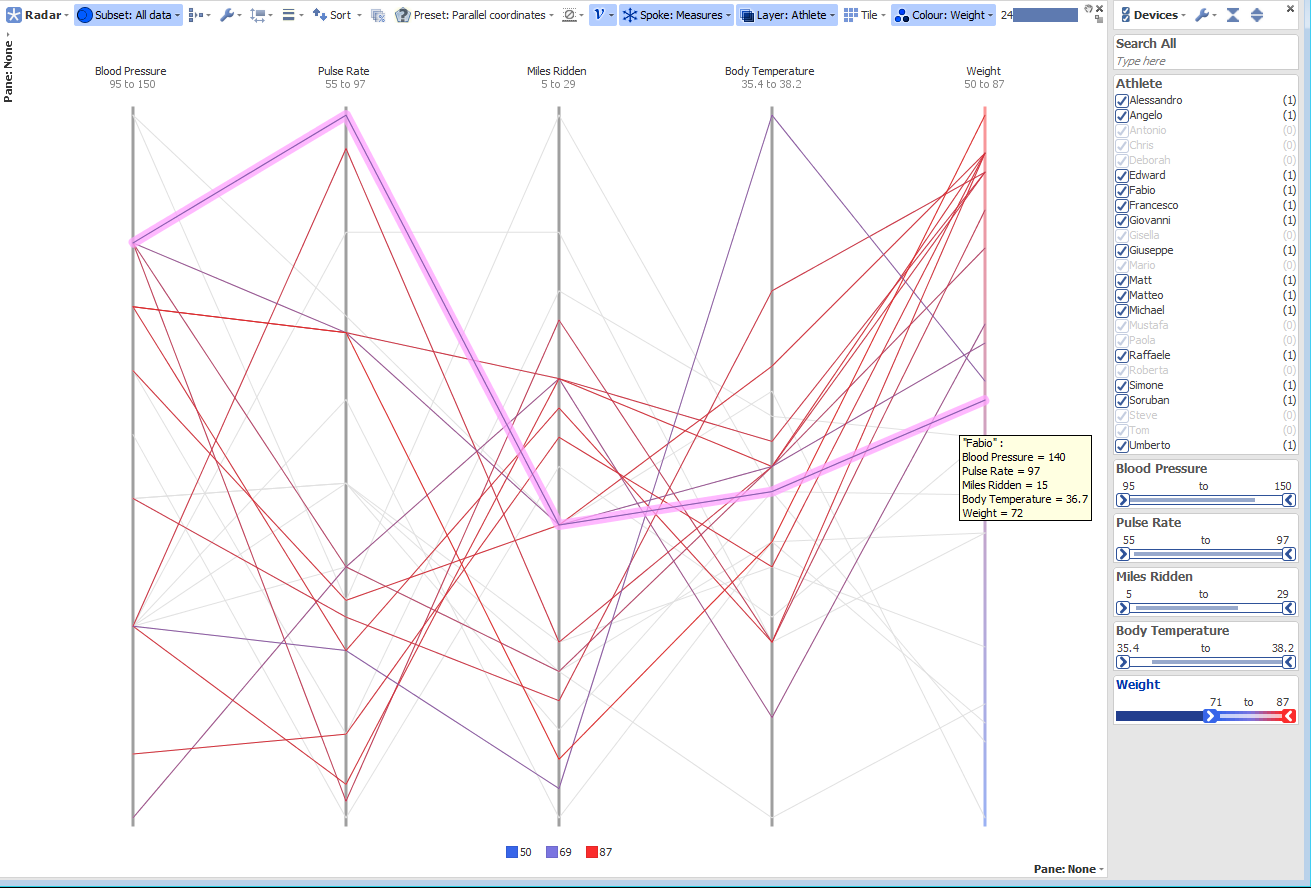
Currently 4 different presets allow you to switch between the different styles and layout settings:- Lines: in radial layout paints polygon lines only
- Lines and Fills: in radial layout paints lines and filled polygons
- Fills: in radial layout paints filled polygons
- Parallel Coordinates: in vertical layout paints lines
Regarding scale options you can switch between:- Vertical Common: A scale will be displayed on the vertical axis, all measures will be proportional to each other.
- Hidden: Same as Vertical Common but no scale will be displayed
- Independent: No scale will be displayed. All measures will be normalised independently.
To fully customise your Radar view, you can play with the following style/layout options:- From the Style drop-down menu:
- Show: Markers, Lines, Fills
- Line opacity
- Line thickness
- Fill opacity N.B. these options are also per measure available.
- From the Spoke drop-down menu:
- Colour spokes
- Show range label on spokes
- Pad spokes at center
- Spokes transparency
- Spokes thickness
- Spokes layout
Here are some common use cases, where the Radar view is the perfect data visualisation plot:
1) Comparing predicted vs actual data:
2) Presenting hourly data: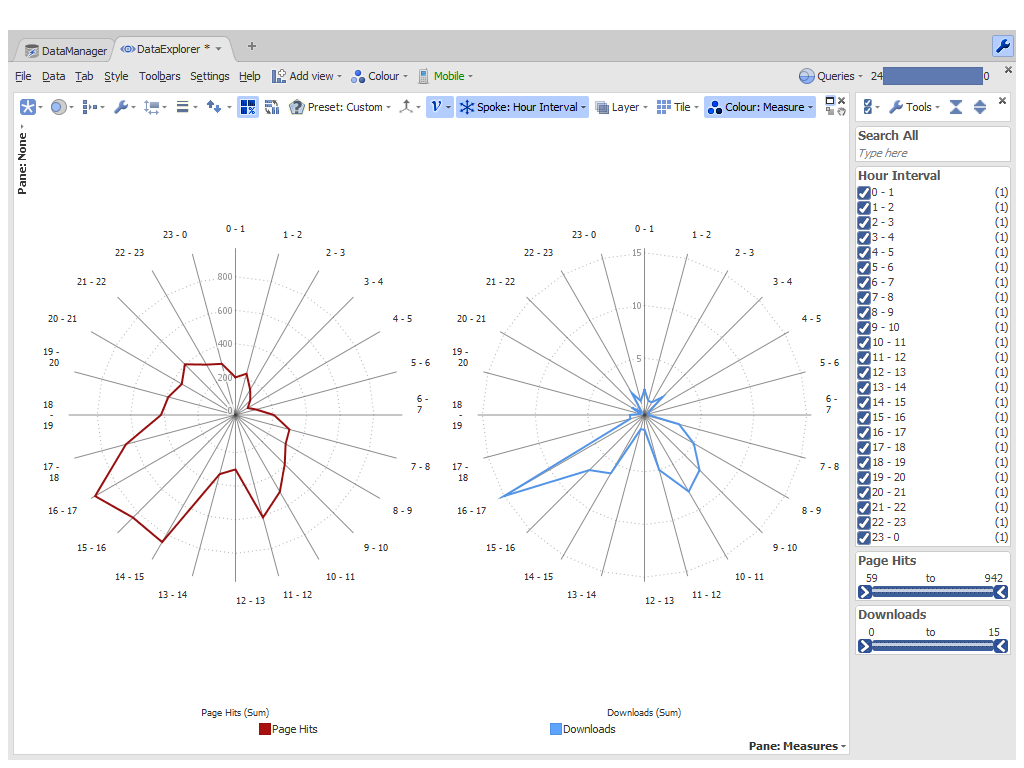
3) Observe distribution of data across different dimensions (multivariate data) with parallel coordinates layout: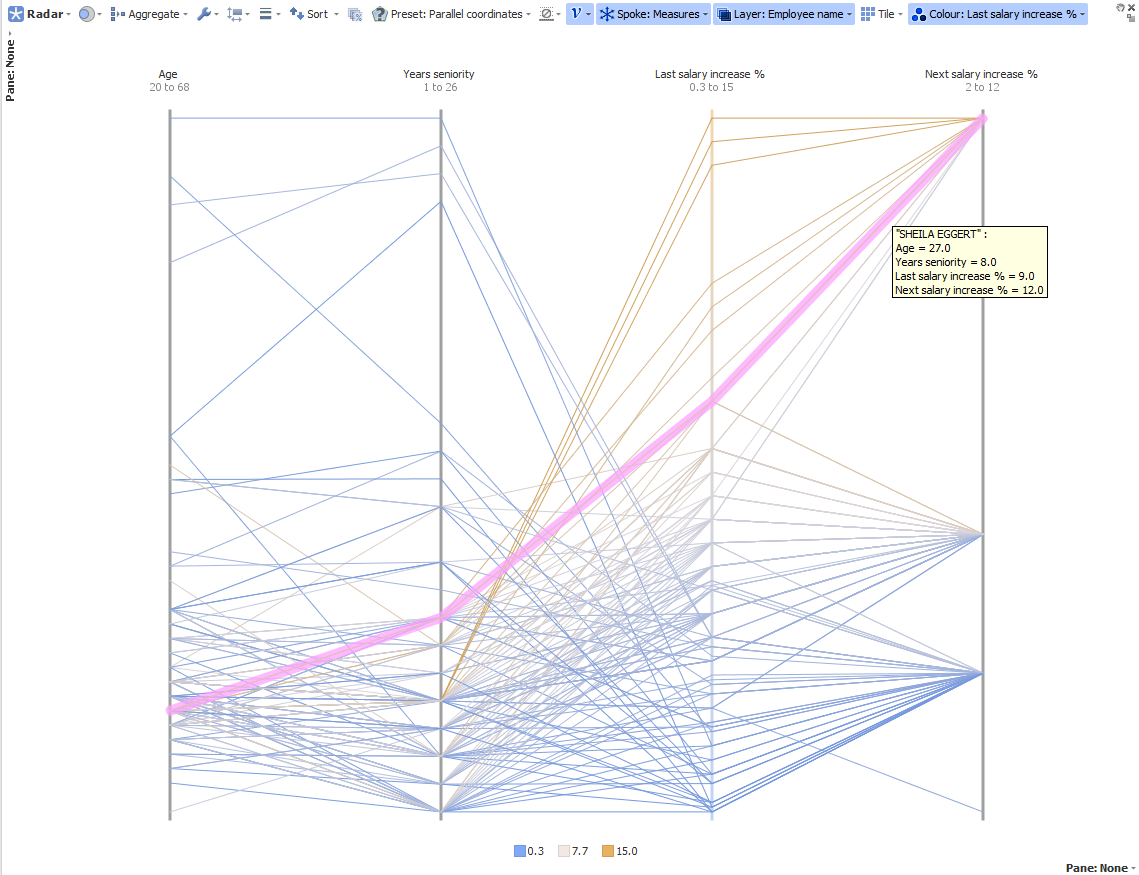
4) Displaying tiles of different "shapes", to visually compare different products/campaigns/individuals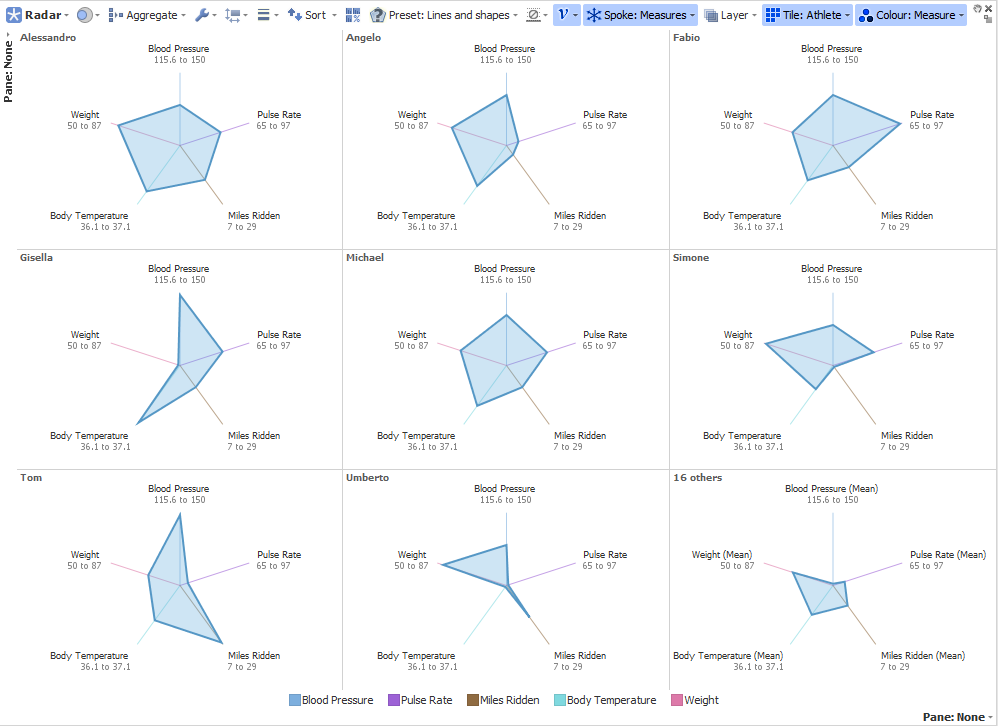 Attachments
radar comparing predicted vs actual.png 62K 
radarTiles.png 76K 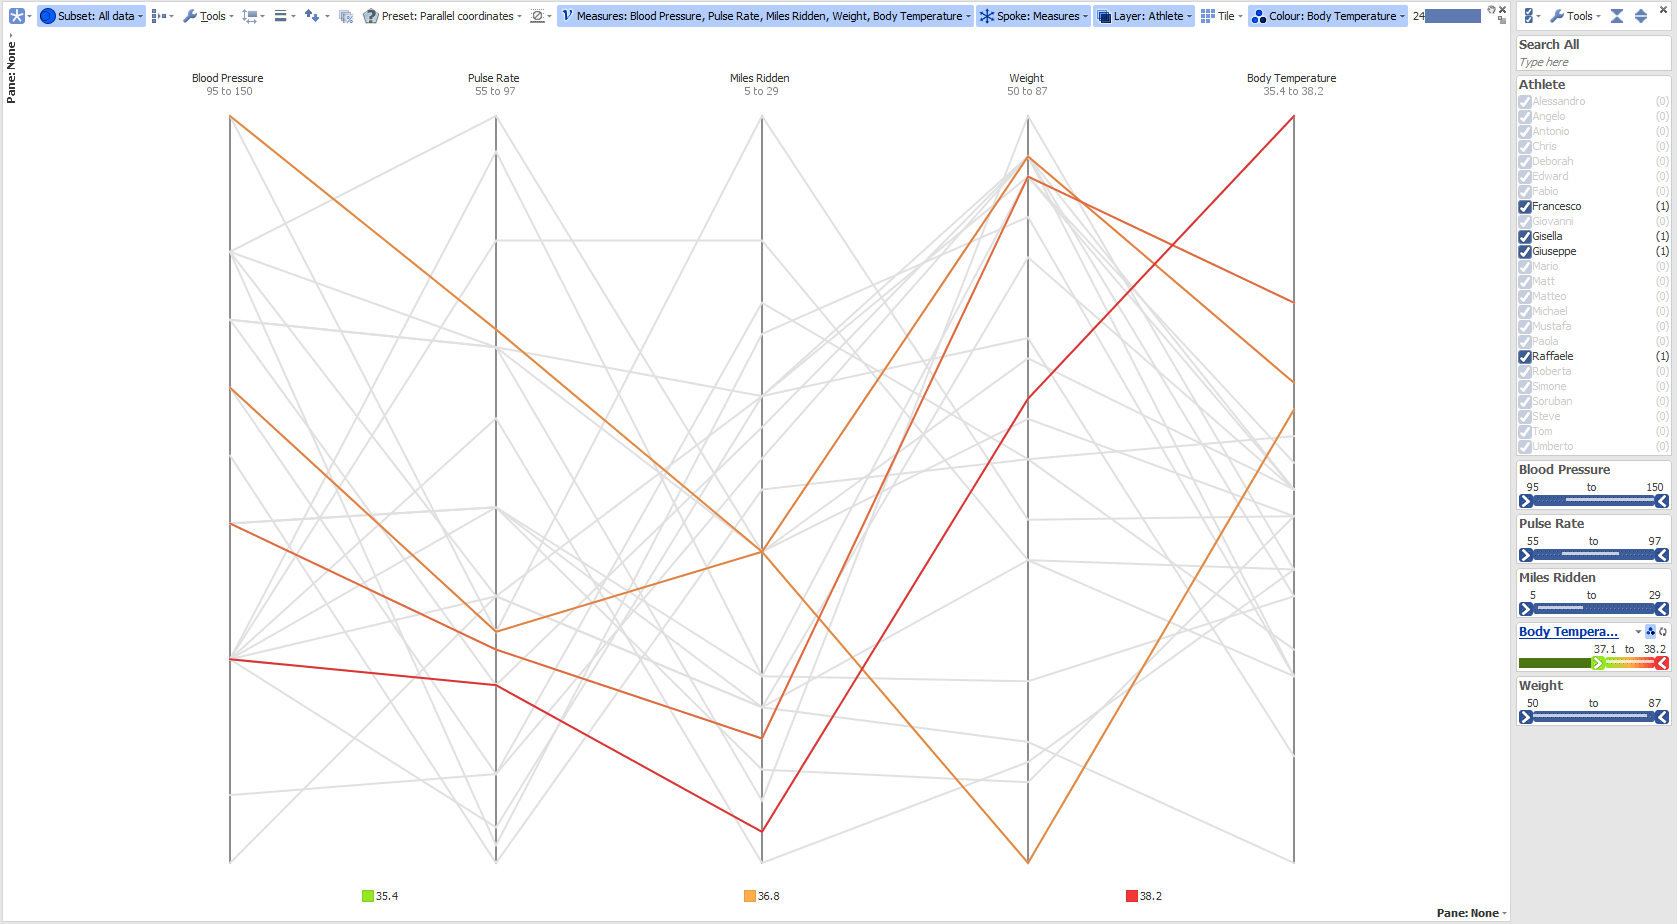
Parallel coordinates.png 253K 
radar hour displaced data.png 167K 
radarParallel.png 368K 
radarParallelBrushing.png 316K - Standard radial layout
-
6 Comments
-
HI there,
We are trying to use the Radar view but have some difficulties with it.
All spokes are scaled the same. So if one spoke has values of 1000 and another has only 10, the one with 10 is very small. Above we read about the option "Independent scaling" and believe this is what we need. However, it is not part of the menu in 2.8 b1088. Can you please let us know how we can do this?
Thanks -
The Scale settings refer to the measures (so not directly to the spokes) to be normalised independently or to be proportional to each other
If your file has only 1 measure and you "Spoke by" measure, then all the spokes will be proportional to each other (on the same scale).
Since there is only 1 measure the option "Scale: Independent" is not visible in the menu (the default will be "Hidden").
If you add another measure then it will be available in the menu (and chosen as default).
To obtain independent panes or layers users can play with the "Normalise panes" and "Normalise layers" view toolbar options.


Welcome!
It looks like you're new here. If you want to get involved, click one of these buttons!
Categories
- All Discussions2,595
- General680
- Blog126
- Support1,177
- Ideas527
- Demos11
- Power tips72
- 3.0 preview2
Tagged
To send files privately to Visokio email support@visokio.com the files together with a brief description of the problem.