Map View: Importing Overlays & Radial selection (2.8+)
-
New in 2.8: import additional datasets into a Map view and show as overlays on top of the chosen base map.
Configurable "Point" overlays show the additional dataset as reference points beneath the main data's markers. The "Spider" option shows links between overlay datapoints and main datapoints, such as linking the sales person to the customer.
"Line" overlays (where the additional dataset is a series of lines, each represented as a series of points) allow you to show routes, for example.
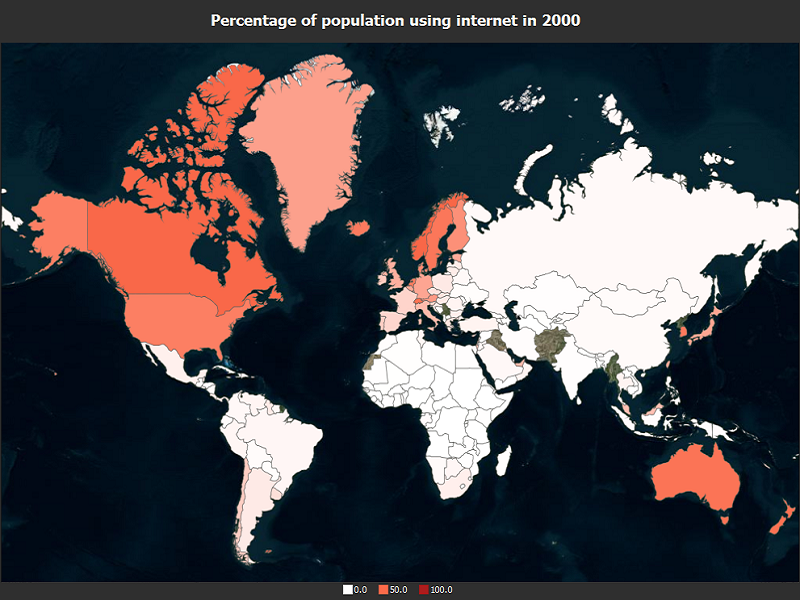
"Area" overlays (as per "Line", but where the path is closed and filled) allow you to show political or administrative areas, areas at risk from natural disaster, or areas within a certain distance of another area or point, for example.
All overlays are highly configurable and can be data-linked to the main datapoints - so overlay data will disappear or re-style as you filter in the sidebar.
You can also use area overlays to select data (by optional join field, or by geometry).
Note that the Map view's "Connect by" menu has also been extended to support equivalent additional functionality such as filled areas.
We have also introduced a Radial selection mode, allowing you to drag from a centre point outwards to select all points accurately within a given distance.
All overlays currently assume WGS84 coordinates. -
1 Comment
-
Line and area overlays displayed with markers of oil and gas well locations around the United Kingdom. Download IOK and source files.

A map view with country area colours based upon values in Omnscope's current dataset. Download IOK and source files. Attachments
UK Oil and Gas.png 451K 
Internet Usage.png 479K 
UK Oil and Gas.zip 6M 
Internet Usage.zip 4M
Welcome!
It looks like you're new here. If you want to get involved, click one of these buttons!
Categories
- All Discussions2,595
- General680
- Blog126
- Support1,177
- Ideas527
- Demos11
- Power tips72
- 3.0 preview2
Tagged
To send files privately to Visokio email support@visokio.com the files together with a brief description of the problem.


