
Bar/line Graph Y-axis maximum value
-
Hello,
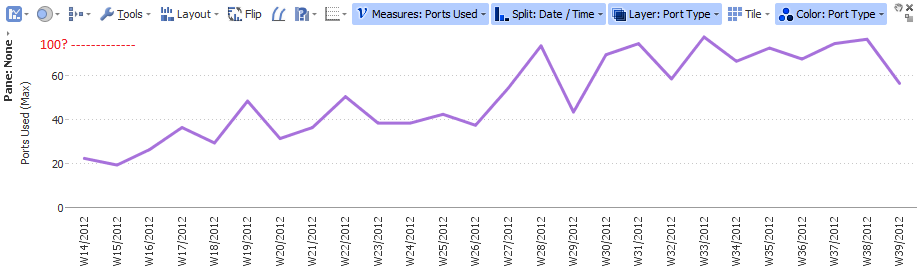
I'd like to know if it's possible to specify a maximum y-axis value like in Excel. For example in the following graph I'd like to have the y-axis maximum value range be 100 instead of 60. Is this possible to do this without having to add a fake data point at the end of the graph?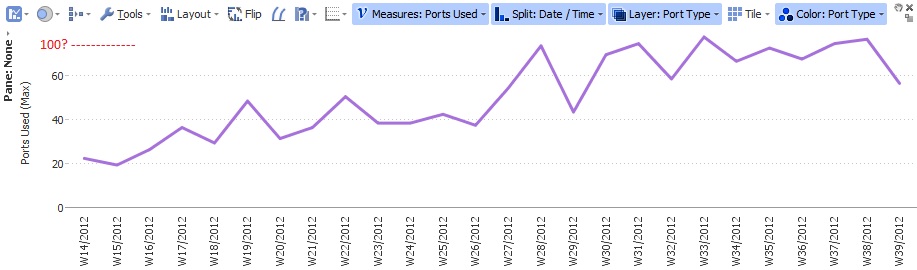
Regards,
Brian
Attachments
omniscope y axis.png 24K omniscope y axis.jpg 63K -
3 Comments
-
Is there an ETS on 2.8, I think this answer my recent post also.


Welcome!
It looks like you're new here. If you want to get involved, click one of these buttons!
Categories
- All Discussions2,595
- General680
- Blog126
- Support1,177
- Ideas527
- Demos11
- Power tips72
- 3.0 preview2
Tagged
To send files privately to Visokio email support@visokio.com the files together with a brief description of the problem.